Degrees of freedom calculator
Look up the degrees of freedom for the test you are running. Choose the test, enter the sample sizes or table dimensions, and the calculator gives the df with the formula and the arithmetic.
The t distribution with 12.43 df. Fewer df mean heavier tails, so the critical value moves out from the normal’s 1.96. The shaded tail is the 5% rejection region; the line marks the critical value.
| Test | Degrees of freedom |
|---|---|
| One-sample t | n − 1 |
| Paired t | pairs − 1 |
| Two-sample t (pooled) | n₁ + n₂ − 2 |
| Welch’s t | Welch–Satterthwaite (see the working) |
| Chi-square goodness of fit | k − 1 − m |
| Chi-square independence | (r − 1)(c − 1) |
| One-way ANOVA | k − 1 and N − k |
| Regression | k and n − k − 1 |
Show the working, step by step
Formula (Welch’s t-test).
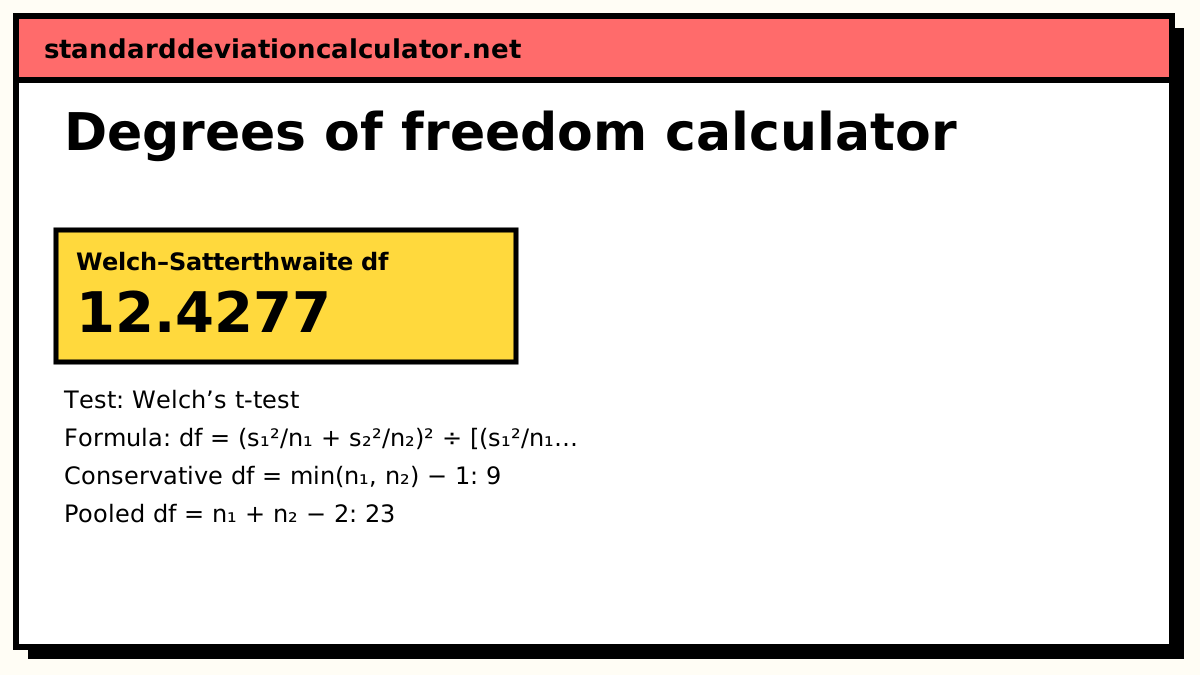
df = (s₁²/n₁ + s₂²/n₂)² ÷ [(s₁²/n₁)²/(n₁ − 1) + (s₂²/n₂)²/(n₂ − 1)]
Substitute the numbers.
s₁²/n₁ = 1.176, s₂²/n₂ = 6.241 df = 55.0119 ÷ (0.098784 + 4.32779) = 12.4277
Welch’s df is usually not a whole number; software uses it as is. Old tables round it down, and the conservative choice is min(n₁, n₂) − 1.
The formulas
| Test | Degrees of freedom |
|---|---|
| One-sample t | n − 1 |
| Paired t | number of pairs − 1 |
| Two-sample t, pooled | n₁ + n₂ − 2 |
| Welch's t | (s₁²/n₁ + s₂²/n₂)² ÷ [(s₁²/n₁)²/(n₁ − 1) + (s₂²/n₂)²/(n₂ − 1)] |
| Chi-square goodness of fit | k − 1 − m (m = parameters estimated) |
| Chi-square independence | (r − 1)(c − 1) |
| One-way ANOVA | between k − 1, within N − k, total N − 1 |
| Linear regression | regression k, residual n − k − 1, total n − 1 |
A worked Welch example
The default is Welch's test with s₁ = 4.2, n₁ = 15 and s₂ = 7.9, n₂ = 10. The second group is smaller and far more variable, which is the situation Welch's formula is built for.
- s₁²/n₁ = 17.64 ÷ 15 = 1.176 and s₂²/n₂ = 62.41 ÷ 10 = 6.241.
- Numerator: (1.176 + 6.241)² = 7.417² = 55.012.
- Denominator: 1.176² ÷ 14 + 6.241² ÷ 9 = 0.0988 + 4.3278 = 4.4266.
- df = 55.012 ÷ 4.4266 = 12.43.
That lies between the conservative bound min(15, 10) − 1 = 9 and the pooled df 15 + 10 − 2 = 23. It sits nearer the smaller sample because the noisier group dominates the standard error. With 12.43 df the two-tailed 5% critical t is 2.171, against 2.069 if you had wrongly pooled.
Other worked values
Switch the test to see the defaults for the others. A one-sample t with n = 20 has 19 df. A paired test on 12 pairs has 11. A pooled test on samples of 15 and 10 has 23. A goodness-of-fit test with six categories and no estimated parameters has 5. A 3 × 4 contingency table has (3 − 1)(4 − 1) = 6, so its 5% critical chi-square value is 12.59. A one-way ANOVA with 4 groups and 36 observations has 3 and 32 df, so F is compared with F(3, 32). A regression with 2 predictors on 20 observations has 2 regression df and 17 residual df.
Why the count matters
The same test statistic can be significant with one df and not with another. A t of 2.1 gives a two-tailed p of 0.049 with 19 df, but 0.13 with 3 df. Getting the df wrong by even one can flip a borderline decision, so it is worth checking against the formula for your exact test.
How to use the result
Degrees of freedom select which member of the t, chi-square or F family to use for the p-value and the critical value. Fewer df mean heavier tails for t and larger critical values, so small samples need stronger evidence. For F you need both df, numerator first.
Common mistakes
- Using n instead of n − 1. Every mean you estimate costs one df.
- Counting cells instead of rows and columns. A 3 × 4 table has 6 df, not 11.
- Forgetting estimated parameters in goodness-of-fit tests. Each fitted parameter costs one more df.
- Pooling df for unequal variances. n₁ + n₂ − 2 overstates the df when the SDs differ. Use Welch.
Common questions
What are degrees of freedom?
The number of values that are free to vary once the quantities you estimated from the data are fixed. If five numbers must have a mean of 10, you can choose any four of them, but the fifth is then forced. So a sample of five has 4 degrees of freedom for estimating the variance.
Why is it n − 1 for a one-sample t-test?
The standard deviation is measured around the sample mean, which was itself estimated from the same n values. The deviations from x̄ always add to zero, so only n − 1 of them are independent. Dividing by n − 1 instead of n also makes s² an unbiased estimate of σ².
How should I round Welch degrees of freedom?
Software uses the exact decimal value. If you must read a printed t table, round down, which gives a slightly larger critical value and a conservative test. In the default example df = 12.43, so a table user would read the row for 12. The critical value is 2.179 there, against 2.171 at the exact 12.43.
When do I subtract extra degrees of freedom in a goodness-of-fit test?
When the expected counts use parameters estimated from the same data. Testing whether counts follow a Poisson distribution with a mean you calculated from the sample costs one more df: df = k − 1 − 1. Testing against fully specified proportions (a fair die) costs none.
Why does ANOVA have two degrees of freedom?
F is a ratio of two mean squares, and each is a sum of squares divided by its own df. The between-groups mean square has k − 1 df and the within-groups one has N − k. The two add to the total N − 1, just as the sums of squares add to the total sum of squares.
Related calculators
-
t statistic calculator
One-sample, Welch, pooled and paired t with its df and p-value.
-
Chi-square calculator
Goodness of fit and independence tests from a table of counts.
-
Critical value calculator
Look up z, t, chi-square and F critical values for any df.