Fisher's exact test calculator
Test whether two yes/no variables are associated when the counts are too small for a chi-square test. Enter the four cells of a 2×2 table; the calculator lists every table with the same totals, its probability, and adds up the ones at least as extreme as yours.
Each bar is the probability of one possible table, labelled by its top-left count a (yours is a = 1). The solid bars add up to the p-value.
| Dieting | Not dieting | Total | |
|---|---|---|---|
| Men | 1 | 9 | 10 |
| Women | 11 | 3 | 14 |
| Total | 12 | 12 | 24 |
Every table with these margins
| a | b | c | d | P(table) | In p-value? |
|---|---|---|---|---|---|
| 0 | 10 | 12 | 2 | 3.365e-5 | Yes |
| 1 | 9 | 11 | 3 | 0.001346 | Yes |
| 2 | 8 | 10 | 4 | 0.01666 | – |
| 3 | 7 | 9 | 5 | 0.08884 | – |
| 4 | 6 | 8 | 6 | 0.2332 | – |
| 5 | 5 | 7 | 7 | 0.3198 | – |
| 6 | 4 | 6 | 8 | 0.2332 | – |
| 7 | 3 | 5 | 9 | 0.08884 | – |
| 8 | 2 | 4 | 10 | 0.01666 | – |
| 9 | 1 | 3 | 11 | 0.001346 | Yes |
| 10 | 0 | 2 | 12 | 3.365e-5 | Yes |
Show the working, step by step
Fix the margins. With row total r₁ and column total c₁, the top-left count a follows a hypergeometric distribution.
r₁ = 10, r₂ = 14, c₁ = 12, N = 24 P(a) = C(r₁, a) · C(r₂, c₁ − a) ÷ C(N, c₁), a from 0 to 10
Probability of the observed table.
P(1) = C(10, 1) · C(14, 11) ÷ C(24, 12) = 0.00134608
One-sided p-values add the tables at least as extreme in one direction.
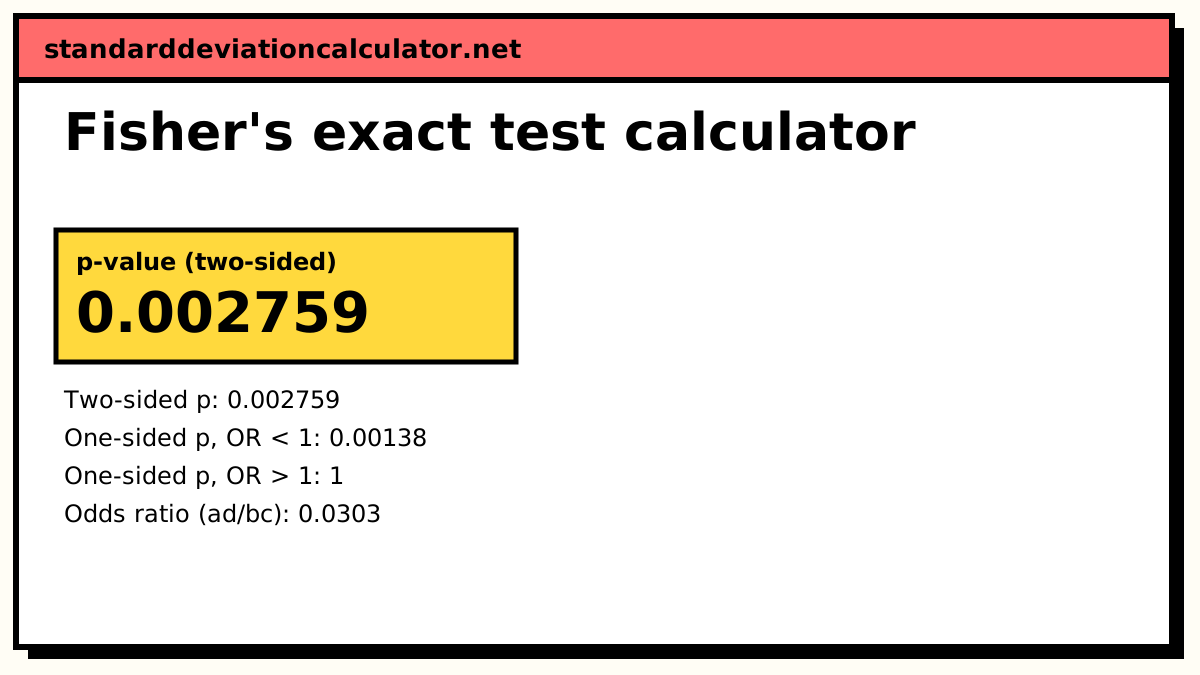
P(a ≤ 1) = 0.00138, P(a ≥ 1) = 1
Two-sided p adds every table whose probability is no larger than the observed one.
p = Σ P(table) for P(table) ≤ 0.00134608 = 0.002759
Sample odds ratio.
OR = ad ÷ bc = (1 × 3) ÷ (9 × 11) = 0.0303
R’s fisher.test gives the same p-values but reports the conditional maximum-likelihood odds ratio, which differs slightly from ad/bc.
The formula
P(a) = C(a + b, a) × C(c + d, c) ÷ C(n, a + c) = (a + b)! (c + d)! (a + c)! (b + d)! ÷ (a! b! c! d! n!)
With every row and column total fixed, the whole table is determined by its top-left cell a, and a follows a hypergeometric distribution. The formula gives the probability of the table you observed if the two variables were unrelated.
Worked example
A survey of 24 teenagers records who is dieting. Of the 10 boys, 1 is dieting; of the 14 girls, 11 are. Is dieting associated with sex?
| Dieting | Not dieting | Total | |
|---|---|---|---|
| Men | 1 | 9 | 10 |
| Women | 11 | 3 | 14 |
| Total | 12 | 12 | 24 |
With 10 men and 12 dieters overall, the number of dieting men could be anything from 0 to 10. The probability of exactly 1 is C(10, 1) × C(14, 11) ÷ C(24, 12) = 10 × 364 ÷ 2,704,156 = 0.001346. The tables at least as unlikely are a = 0 (0.000034), a = 1, and at the other end a = 9 (0.001346) and a = 10 (0.000034).
p = 0.000034 + 0.001346 + 0.001346 + 0.000034 = 0.002759
The two-sided p-value is 0.0028, well below 0.05, so dieting and sex are associated in this sample. The one-sided p-value for "men diet less" is P(a ≤ 1) = 0.0014. The odds ratio is (1 × 3) ÷ (9 × 11) = 0.030: the odds of a boy dieting are about 3% of the odds for a girl.
When to use it
Use Fisher's test for a 2×2 table of counts from two independent groups when any expected count, (row total × column total) ÷ n, is below 5. In the example the expected number of dieting men is 10 × 12 ÷ 24 = 5, right at the limit, and the chi-square approximation would be unreliable. For larger counts the chi-square test and Fisher's test agree closely.
Interpreting the result
A small p-value says the split is unlikely if the variables are independent. It does not say how strong the association is; the odds ratio does that. With counts this small, the odds ratio is very imprecise, so report it with caution or with an exact confidence interval from statistical software.
Fisher's test is conservative: because a can only take whole-number values, the actual false-positive rate is usually a little below α. Some analysts report the mid-p value for this reason, but the standard p-value is what journals expect.
Common mistakes
- Using it on paired data, such as the same people before and after. That needs McNemar's test.
- Entering percentages instead of counts. The test needs whole numbers.
- Doubling a one-sided p-value when the distribution is not symmetric and calling it two-sided.
- Reading a non-significant result in a tiny table as evidence of no association. Small tables have little power.
Common questions
When should I use Fisher's exact test instead of chi-square?
When the counts are small. The chi-square test relies on a large-sample approximation that breaks down when any expected count is below 5. Fisher's test computes the p-value exactly from the hypergeometric distribution, so it is valid at any sample size. For large tables the two give nearly the same answer, and chi-square is faster.
How is the two-sided p-value calculated?
By adding the probabilities of every table with the same margins that is no more likely than the observed one. This is the rule used by R's fisher.test and most software. Some textbooks instead double the one-sided p-value; that gives the same result when the distribution is symmetric, as in the default example, but can differ otherwise.
Why are the row and column totals fixed?
Fisher's test conditions on the margins: it asks, given that 12 of the 24 people were dieting and 10 were men, how likely is a split this uneven? Conditioning removes the unknown overall rates from the problem, which is what makes an exact answer possible.
What does the odds ratio tell me?
How much higher the odds of column 1 are in row 1 than in row 2. In the example the odds of dieting are 1/9 for men and 11/3 for women, a ratio of (1 × 3) ÷ (9 × 11) = 0.030. An odds ratio of 1 means no association. When a cell is zero the ratio is 0 or infinite, so the calculator also shows the version with 0.5 added to every cell.
Can Fisher’s exact test handle tables larger than 2×2?
The Fisher–Freeman–Halton extension can, but it is expensive to compute. This calculator handles 2×2 tables. For larger tables with adequate counts, use the chi-square test of independence.
Related calculators
-
Chi-square calculator
Test independence in larger contingency tables.
-
McNemar's test
The 2×2 test for paired yes/no data.
-
Conditional probability
Read conditional probabilities from the same 2×2 table.