A/B test calculator
Enter visitors and conversions for the control (A) and the variant (B). The calculator gives both conversion rates, the uplift, the p-value from a two-proportion z-test, a confidence interval for the difference and how many visitors a properly powered test would need.
For the sample-size plan: the smallest relative lift worth detecting, e.g. 10 for +10%.
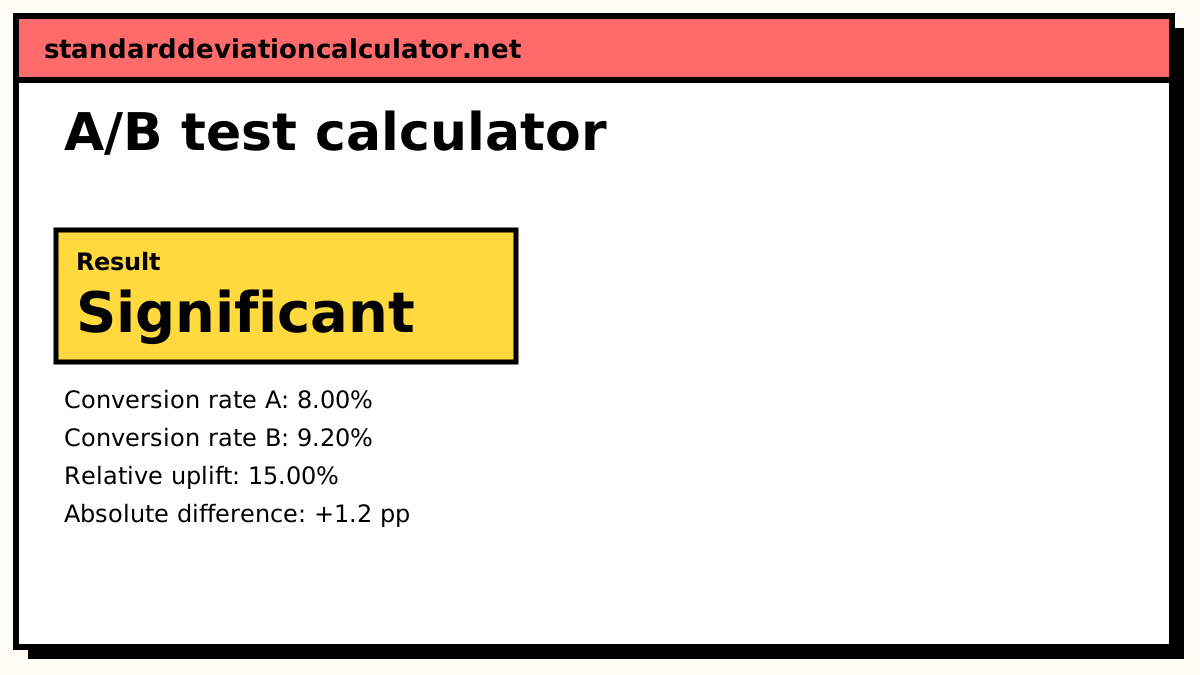
B's conversion rate is higher than A's and the difference is statistically significant at 95% confidence (p = 0.03235).
To detect a 10% relative change from the 8.00% baseline (to 8.80%) with 80% power at α = 0.05, plan for about 18,872 visitors per variant (37,744 in total).
| Variant | Visitors | Conversions | Rate |
|---|---|---|---|
| A (control) | 5,000 | 400 | 8.00% |
| B (variant) | 5,000 | 460 | 9.20% |
Show the working, step by step
Conversion rates.
p̂A = 400 ÷ 5000 = 0.08, p̂B = 460 ÷ 5000 = 0.092
Relative uplift of B over A.
(p̂B − p̂A) ÷ p̂A = 0.012 ÷ 0.08 = 15.00%
Pooled rate, assuming H₀ (no difference) is true.
p̄ = (400 + 460) ÷ (5000 + 5000) = 0.086
Pooled standard error and z.
SE₀ = √(p̄(1 − p̄)(1/nA + 1/nB)) = 0.00560728 z = (p̂B − p̂A) ÷ SE₀ = 0.012 ÷ 0.00560728 = 2.1401
p-value (two-sided).
p = 2 × P(Z > |z|) = 0.03235
95% confidence interval for the difference uses the unpooled SE.
SE = √(p̂A(1 − p̂A)/nA + p̂B(1 − p̂B)/nB) = 0.005606 0.012 ± 1.96 × 0.005606 = [0.00101245, 0.0229876]
Decide the sample size before the test starts and stop there. Checking the p-value every day and stopping when it dips under 0.05 inflates the false-positive rate well above α.
The formulas
p̄ = (x_A + x_B) ÷ (n_A + n_B) z = (p̂_B − p̂_A) ÷ √(p̄(1 − p̄)(1/n_A + 1/n_B)) CI = (p̂_B − p̂_A) ± z* √(p̂_A(1 − p̂_A)/n_A + p̂_B(1 − p̂_B)/n_B)
The test uses the pooled rate p̄ because it assumes, under H₀, that A and B convert at the same rate. The confidence interval does not make that assumption, so it uses each variant's own rate. That is why the two can disagree by a hair right at the boundary.
Worked example
A checkout page test sends 5,000 visitors to each version. The control converts 400 (8.00%) and the new design converts 460 (9.20%).
- Absolute difference: 9.20% − 8.00% = 1.2 percentage points.
- Relative uplift: 0.012 ÷ 0.08 = 15%.
- Pooled rate: 860 ÷ 10,000 = 0.086, standard error √(0.086 × 0.914 × 2/5,000) = 0.005607.
- z = 0.012 ÷ 0.005607 = 2.14, two-sided p = 0.032.
- 95% interval for B − A: +0.10 to +2.30 percentage points.
p is below 0.05 and the interval excludes zero, so the new design's higher rate is statistically significant at 95% confidence. The interval is wide, though: the true lift could be as small as a tenth of a point or as large as 2.3 points. That range is the honest summary of what 10,000 visitors can tell you.
Significance is not the whole answer
A significant result says the lift is probably not zero. Whether to ship B depends on the size of the lift and its cost. If building and maintaining the new design only pays off above a 1-point gain, this test has not shown that: the interval runs from 0.1 to 2.3 points and most of it is below 1. In that case, run a larger follow-up test rather than treating p = 0.032 as the end of the story.
Planning the sample size
The minimum detectable effect (MDE) is the smallest relative lift worth finding. With the 8% baseline and an MDE of 10% (8.0% → 8.8%), the calculator needs about 18,872 visitors per variant for 80% power at α = 0.05. The formula is
n = [z_α/2 √(2p̄(1 − p̄)) + z_β √(p₁(1 − p₁) + p₂(1 − p₂))]² ÷ (p₂ − p₁)²
The example test above, with 5,000 per variant, only had about a 57% chance of detecting a true 15% lift, so it was somewhat lucky to reach significance. Decide the sample size before launching, run to that size, then read the result once.
Common mistakes
- Peeking at the p-value daily and stopping when it first dips under 0.05.
- Reading "not significant" as "no difference". An underpowered test often misses real lifts.
- Counting visits instead of users, so one person appears several times and the observations are not independent.
- Testing many metrics or many variants and reporting whichever came out significant. Correct for multiple comparisons with the Bonferroni calculator.
- Ending a test mid-week when behaviour differs by weekday. Run whole weeks where you can.
Common questions
How do I know if my A/B test result is statistically significant?
Compare the p-value with the significance level you chose before the test. If p is below α (0.05 for 95% confidence), the difference between the conversion rates is unlikely to be random noise. Also check the confidence interval: if it does not include zero, the result is significant at the matching level.
What is relative uplift?
The change in conversion rate as a share of the control rate: (p_B − p_A) ÷ p_A. Going from 8% to 9.2% is an absolute change of 1.2 percentage points and a relative uplift of 15%. Report both, because a 15% uplift on a 0.5% rate is a very different business result from 15% on 30%.
How many visitors do I need for an A/B test?
It depends on the baseline rate, the smallest lift you care about and the power you want. Detecting a 10% relative lift on an 8% baseline with 80% power at α = 0.05 takes about 18,900 visitors per variant. Halving the detectable lift roughly quadruples the sample.
Can I stop the test as soon as it becomes significant?
Not with this test. The p-value is only valid at a sample size fixed in advance. Checking daily and stopping at the first p < 0.05 can push the real false-positive rate to 20% or more. Fix the sample size first, or use a sequential method designed for repeated looks.
Should I use a one-sided or two-sided test?
Two-sided is the safer default: it also detects a variant that hurts conversions. A one-sided test (B > A) has more power for the same sample, but only makes sense if a worse B and an equal B would lead to the same decision, and you chose it before the test began.
Related calculators
-
Power analysis calculator
Sample size and power for proportions, t-tests and correlations.
-
Fisher's exact test
Exact p-value for a 2×2 table when conversions are few.
-
Z-test calculator
One- and two-sample z-tests for means and proportions.