Covariance calculator
Enter pairs of x and y values. The calculator lays out every deviation from the mean, adds the products, and gives the sample and population covariance along with the correlation.
One pair per row. Paste two columns from a spreadsheet, or use Add row.
| x | y | x − x̄ | y − ȳ | (x − x̄)(y − ȳ) |
|---|---|---|---|---|
| 2 | 3 | −4 | −4.4 | 17.6 |
| 4 | 7 | −2 | −0.4 | 0.8 |
| 6 | 5 | 0 | −2.4 | 0 |
| 8 | 10 | 2 | 2.6 | 5.2 |
| 10 | 12 | 4 | 4.6 | 18.4 |
| Σ | 0 | 0 | 42 |
┄ x̄ and ȳ (dashed)
Show the working, step by step
Find the two means.
x̄ = 30 ÷ 5 = 6 ȳ = 37 ÷ 5 = 7.4
Multiply each pair of deviations and add the products.
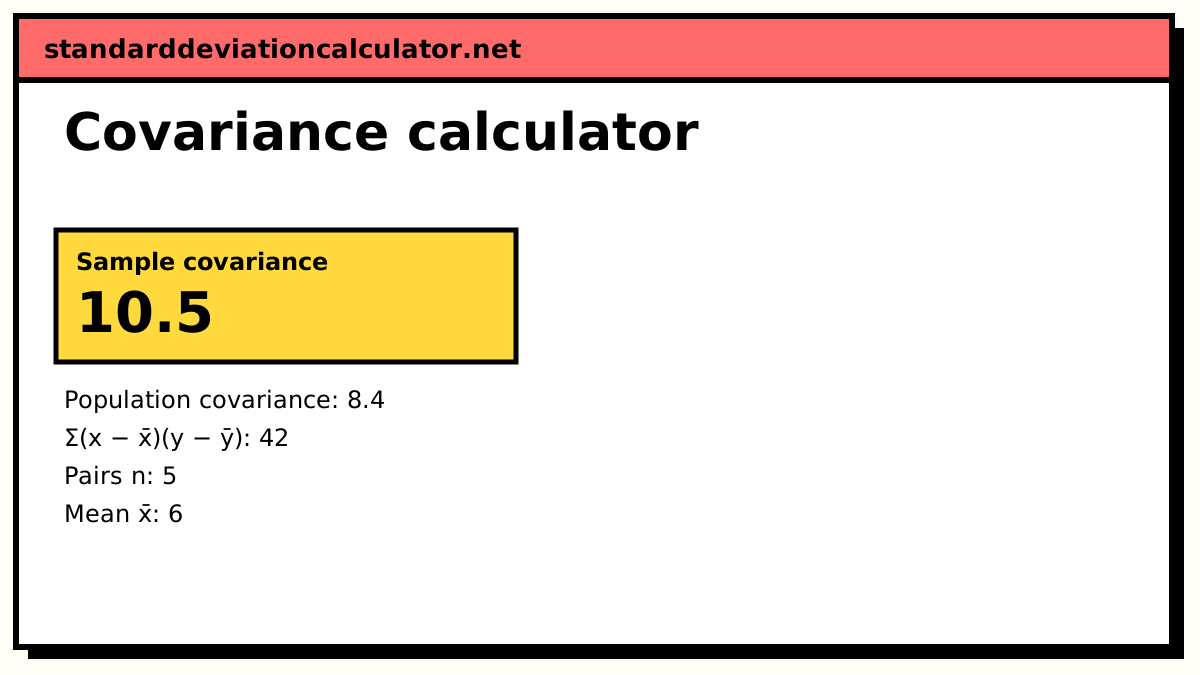
Σ(x − x̄)(y − ȳ) = 17.6 + 0.8 + 0 + 5.2 + 18.4 = 42
Sample covariance divides by n − 1.
sxy = 42 ÷ 4 = 10.5
Population covariance divides by n.
σxy = 42 ÷ 5 = 8.4
Scale by both standard deviations to get the correlation, which lies between −1 and 1.
r = Σ(x − x̄)(y − ȳ) ÷ √(Σ(x − x̄)² × Σ(y − ȳ)²) = 42 ÷ √(40 × 53.2) = 0.9105
Covariance is in x-units × y-units, so its size depends on the scale of the data. Use r to judge how strong the relationship is.
The formulas
sample: sxy = Σ(x − x̄)(y − ȳ) ÷ (n − 1) population: σxy = Σ(x − x̄)(y − ȳ) ÷ n
Each pair contributes the product of its two deviations. A point up and to the right of the means (both deviations positive) or down and to the left (both negative) adds a positive product. Points in the other two quadrants add negative products. The sign of the total says which pattern dominates.
A worked example
The default data has five pairs. The means are x̄ = 30 ÷ 5 = 6 and ȳ = 37 ÷ 5 = 7.4.
| x | y | x − x̄ | y − ȳ | product |
|---|---|---|---|---|
| 2 | 3 | −4 | −4.4 | 17.6 |
| 4 | 7 | −2 | −0.4 | 0.8 |
| 6 | 5 | 0 | −2.4 | 0 |
| 8 | 10 | 2 | 2.6 | 5.2 |
| 10 | 12 | 4 | 4.6 | 18.4 |
| Σ | 0 | 0 | 42 |
sxy = 42 ÷ 4 = 10.5 σxy = 42 ÷ 5 = 8.4
The deviations in each column always add to zero, which is a quick check on the means. With Σ(x − x̄)² = 40 and Σ(y − ȳ)² = 53.2, the correlation is 42 ÷ √(40 × 53.2) = 0.9105, a strong positive linear relationship.
Interpreting covariance
Read the sign, not the size. Positive covariance means the variables rise together, negative means one falls as the other rises. The magnitude is in x-units times y-units (for heights in cm and weights in kg, cm·kg), so it changes whenever you rescale either variable and cannot be compared across data sets. The correlation coefficient fixes that. Covariance is still the building block for regression slopes (b = sxy ÷ sx²), portfolio risk, and principal component analysis.
More than two variables
With three or more variables, the pairwise covariances are collected in a covariance matrix: the variances run down the diagonal and each off-diagonal entry is the covariance of one pair. The matrix is symmetric because cov(x, y) = cov(y, x). To build one, run this calculator on each pair of columns; the sample variance of a single column is its covariance with itself.
Common mistakes
- Mixing the two denominators. Use n − 1 for a sample, n only when the data is the whole population. Spreadsheets have separate functions for each.
- Pairing values from different rows. Covariance needs the x and y from the same case.
- Reading a covariance of zero as "unrelated". y = x² over x = −2 to 2 has zero covariance but a perfect curved relationship.
- Comparing covariances measured in different units.
Common questions
What is the difference between sample and population covariance?
Both start from the same sum of products of deviations, Σ(x − x̄)(y − ȳ). Sample covariance divides it by n − 1 and estimates the covariance of a larger population; population covariance divides by n and describes the data you have as the whole population. In Excel these are COVARIANCE.S and COVARIANCE.P.
What does a negative covariance mean?
That when x is above its mean, y tends to be below its mean, and the other way round: the two variables move in opposite directions. A positive covariance means they tend to move together. A covariance near zero means there is no linear tendency either way, though there may still be a curved relationship.
How is covariance related to correlation?
Correlation is covariance divided by the product of the two standard deviations: r = sxy ÷ (sx sy). That removes the units and puts the result between −1 and 1. For the default data, r = 42 ÷ √(40 × 53.2) = 0.9105.
Is a covariance of 10.5 large?
You cannot tell from covariance alone. Its size depends on the units: measure x in centimetres instead of metres and the covariance grows 100-fold while the relationship is unchanged. Use the correlation coefficient to judge strength.
What is the covariance of a variable with itself?
Its variance. Setting y = x in the formula gives Σ(x − x̄)² ÷ (n − 1), the sample variance. That is why the diagonal of a covariance matrix holds the variances.
Related calculators
-
Correlation coefficient calculator
The unit-free version of covariance, from −1 to 1.
-
Linear regression calculator
The slope is covariance divided by the variance of x.
-
Portfolio standard deviation
Where covariances between assets set the risk of a mix.