Midrange calculator
Enter your numbers to get the midrange, the point halfway between the minimum and maximum, with the mean and median beside it so you can see whether it is a fair summary of your data.
Separate with commas, spaces or new lines.
Show the working, step by step
Sort the data (or just find the smallest and largest values).
3, 7, 8, 9, 12, 15, 40 min = 3, max = 40
Add the two and halve.
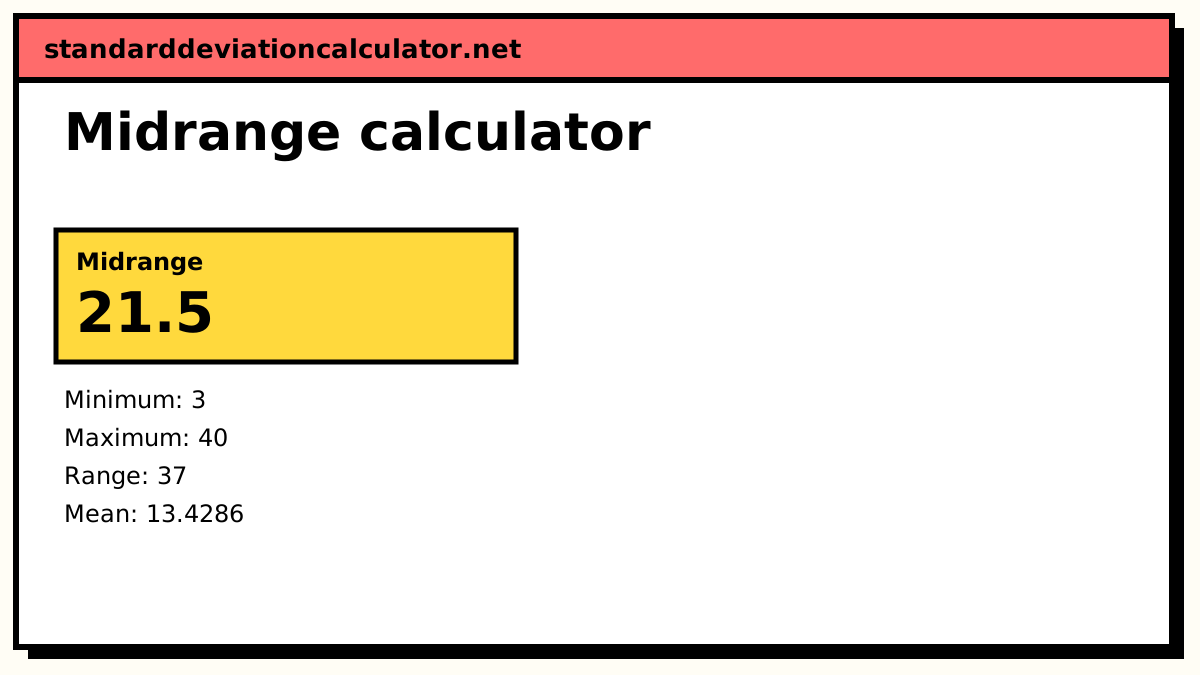
midrange = (3 + 40) ÷ 2 = 43 ÷ 2 = 21.5
Compare with the other centres.
mean = 94 ÷ 7 = 13.4286 median = 9
The midrange is above the median by 12.5. The midrange uses only the two extremes, so one large value pulls it a long way.
The formula
midrange = (minimum + maximum) ÷ 2
Only two numbers matter: the smallest and the largest. You do not need to sort the whole list, just find its extremes.
A worked example
The default data are seven values: 3, 7, 8, 9, 12, 15, 40.
midrange = (3 + 40) ÷ 2 = 43 ÷ 2 = 21.5
For comparison:
- Mean = (3 + 7 + 8 + 9 + 12 + 15 + 40) ÷ 7 = 94 ÷ 7 = 13.43.
- Median = the 4th of the 7 sorted values = 9.
Six of the seven values are 15 or less, yet the midrange is 21.5, bigger than all of them. The single value 40 is responsible. The mean is pulled up too, but less, because 40 is only one of seven values in the average. The median ignores how large 40 is and stays at 9. On the dot plot under the calculator you can see the midrange line sitting in an empty stretch of the axis.
Change 40 to 17 and the three centres close up: the midrange becomes 10, the mean 10.14 and the median still 9. That is the pattern for data without outliers.
Interpreting the midrange
Treat the midrange as the centre of the interval your data cover, not as a typical value. It answers "what is halfway between the extremes?", which is useful for things defined by their limits: a thermostat band, a tolerance, or the day's high and low temperature. When the midrange is far from the mean and median, the data are skewed or have an outlier at one end, and the midrange is misleading as a summary.
The midrange also has a partner measure of spread, the half-range (max − min) ÷ 2. Together they describe the interval: midrange ± half-range covers every value.
Common mistakes
- Confusing the midrange with the range. The range is max − min, a spread; the midrange is (max + min) ÷ 2, a location.
- Confusing the midrange with the median. They coincide only for symmetric data.
- Using the first and last values as typed instead of the minimum and maximum. Unsorted lists rarely start and end with their extremes.
- Reporting the midrange of data with outliers as the "average".
Common questions
What is the midrange?
The value halfway between the smallest and largest values in a data set: (min + max) ÷ 2. It is a measure of centre, like the mean and median, but it uses only the two extremes.
Is the midrange the same as the median?
No. The median is the middle value when the data are sorted; the midrange is the middle of the interval the data cover. For 3, 7, 8, 9, 12, 15, 40 the median is 9 but the midrange is 21.5, because the single large value 40 drags the midrange up.
Is the midrange the same as half the range?
No. Half the range, (max − min) ÷ 2, is a measure of spread: 18.5 in the example. The midrange, (max + min) ÷ 2, is a location: 21.5. The data span midrange ± half-range, from 21.5 − 18.5 = 3 to 21.5 + 18.5 = 40.
When is the midrange a good measure of centre?
When the data are symmetric with short, bounded tails and no outliers, such as values from a uniform distribution. There it is actually a more precise estimate of the centre than the mean. For most real data, with longer tails or the odd outlier, the mean or median is more reliable.
Where is the midrange used?
Quick estimates of a centre: the daily mean temperature in many weather records is the midrange of the day's high and low; the midpoint of a price band or a tolerance range is a midrange too.
Related calculators
-
Mean, median, mode and range
All the basic summaries of a list at once.
-
Range calculator
Max minus min, the spread partner of the midrange.
-
Min and max calculator
Find the extremes of a list quickly.