Quartile, decile and percentile calculators
Calculators that split sorted data into equal parts: quartiles into four, deciles into ten, percentiles into a hundred. Use them to find the value at a given position, the position of a given value, or a measure of spread built from the middle of the data.
Which calculator do I need?
| You have or want | Use |
|---|---|
| Q1, the median and Q3 of a list or grouped data | Quartile calculator |
| Minimum, Q1, median, Q3 and maximum for a box plot | Five-number summary |
| The interquartile range and any outliers | Outlier & IQR calculator |
| The value at a given percentile, such as the 90th | Percentile calculator |
| What percentile a particular score falls at | Percentile rank calculator |
| Deciles D1 to D9, such as for income bands | Decile calculator |
| The semi-interquartile range (Q3 − Q1)/2 and its coefficient | Quartile deviation calculator |
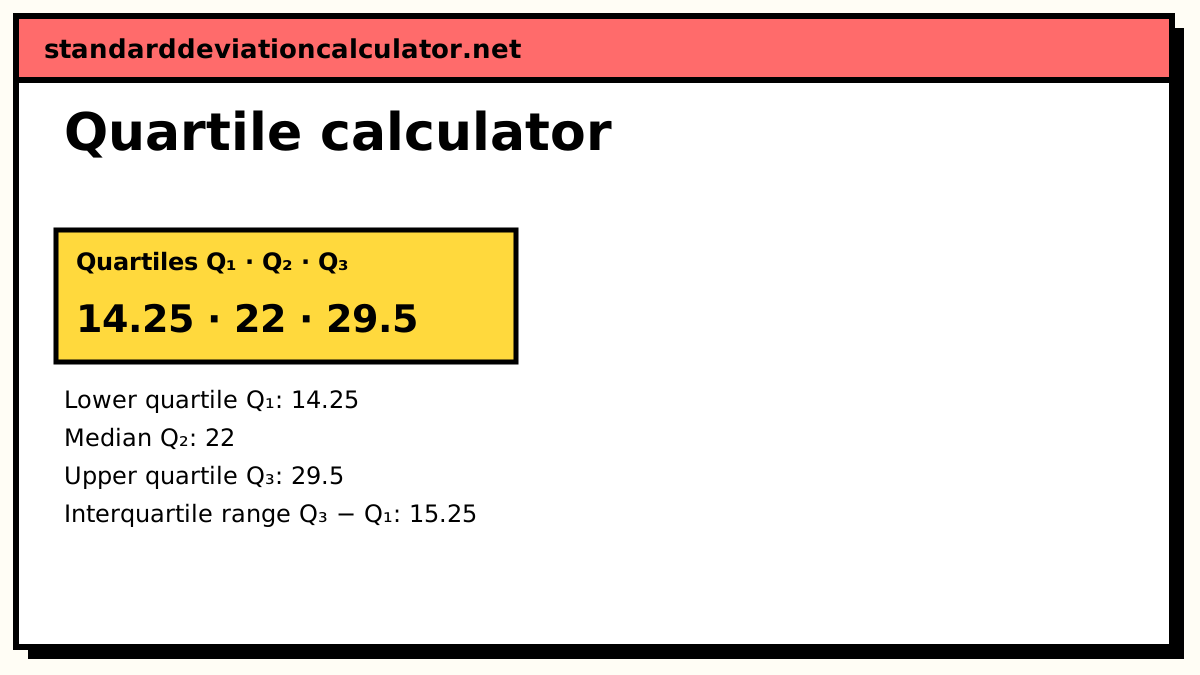
Quartiles and the five-number summary
The three cut points that split sorted data into quarters, and the summaries built from them.
-
Quartile calculator
Q1, Q2 and Q3 for a list, a discrete (x, f) series or class intervals, with the textbook and Excel methods.
-
Five-number summary
Minimum, Q1, median, Q3 and maximum, ready to draw as a box plot.
-
Outlier & IQR calculator
The interquartile range Q3 − Q1, with Tukey fences and flagged outliers.
-
Box plot calculator
Box-and-whisker plots for one or several data sets, with quartiles, fences and outliers.
Percentiles and deciles
Finer cut points: find the value at a position, or the position of a value.
-
Percentile calculator
The value at any percentile of your data, with the quartiles and IQR.
-
Percentile rank calculator
The percentile rank of a value, by the half-ties or strictly-below rule, or the value at a given rank.
-
Decile calculator
Any decile D1 to D9 from a list, a frequency table or class intervals.
Spread from quartiles and deciles
Measures of spread that ignore the extremes and so resist outliers.
-
Quartile deviation calculator
Quartile deviation (Q3 − Q1)/2 and its coefficient for individual, discrete and grouped data.
-
Decile deviation calculator
Interdecile range D9 − D1, the decile deviation (D9 − D1)/2 and its coefficient.
-
Upper and lower fence calculator
Lower and upper fences Q₁ − k·IQR and Q₃ + k·IQR, from data or from the quartiles.
Quartiles, deciles and percentiles are the same idea
Sort the data, then cut it into equal-sized parts. Three cuts give quartiles (Q1, Q2, Q3), nine give deciles (D1 to D9) and ninety-nine give percentiles (P1 to P99). They line up: Q1 = P25, the median = Q2 = D5 = P50, and Q3 = P75. So the percentile calculator can answer any quartile or decile question, while the quartile and decile calculators add grouped-data formulas and the working textbooks expect.
Why two calculators can give different quartiles
There is no single agreed rule for where a quartile falls between two data values. Take the nine values 3, 5, 7, 8, 12, 13, 14, 18, 21. The median is 12 by every method, but:
- Splitting the data into lower and upper halves (excluding the median) and taking the median of each gives Q1 = 6 and Q3 = 16, so IQR = 10. Excel’s QUARTILE.EXC gives the same here.
- Excel’s QUARTILE.INC, which interpolates at position 1 + (n − 1)p, gives Q1 = 7 and Q3 = 14, so IQR = 7.
Neither is wrong. The gap shrinks as the dataset grows. For homework, match the method in your textbook; for a report, say which method you used. The quartile calculator shows the textbook method and Excel’s side by side.
Percentile vs percentile rank
These run in opposite directions. A percentile starts from a percentage and returns a value: the 90th percentile of a set of exam scores might be 84. A percentile rank starts from a value and returns a percentage: a score of 84 might have a percentile rank of 90. In the list above, 18 has 7 of the 9 values below it, a rank of 77.8% by the strictly-below rule, or 83.3% if the value itself counts as half.
Spread from the middle half
The interquartile range covers the middle 50% of the data, so the extremes cannot distort it. The quartile deviation is half of it, and the decile deviation uses D9 − D1 to cover the middle 80%. The fences Q1 − 1.5·IQR and Q3 + 1.5·IQR are the usual cut-offs for outliers and the ends of a box plot’s whiskers.