Statistics
Quartile calculator
Enter a list of values, a frequency table or class intervals to get the three quartiles, with the position or class used for each and the full working. Choose the method your textbook or software uses; grouped data always uses the class-interval formula.
Separate with commas, spaces or new lines.
Exclusive classes (10-20, 20-30) or inclusive classes (10-19, 20-29). Inclusive classes are converted to class boundaries.
Grouped (continuous) data always uses the class-interval formula.
inside the interquartile range Q₁ to Q₃ outside it
| Method | Q₁ | Q₂ | Q₃ |
|---|---|---|---|
| (n + 1) interpolation — textbook, Excel QUARTILE.EXC | 14.25 | 22 | 29.5 |
| (n − 1) interpolation — Excel QUARTILE.INC, Sheets, R | 15.5 | 22 | 28.25 |
| Median of each half — TI-84 | 15 | 22 | 29 |
Show the working, step by step
Arrange the 10 values in ascending order.
8, 12, 15, 17, 21, 23, 26, 29, 31, 38
Q₁ = size of the (n + 1)/4th item = (10 + 1)/4 = 2.75th item.
Q₁ = 2nd item + 0.75 × (3rd item − 2nd item) = 12 + 0.75 × (15 − 12) = 14.25
Q₂ = size of the 2(n + 1)/4th item = 2 × (10 + 1)/4 = 5.5th item.
Q₂ = 5th item + 0.5 × (6th item − 5th item) = 21 + 0.5 × (23 − 21) = 22
Q₃ = size of the 3(n + 1)/4th item = 3 × (10 + 1)/4 = 8.25th item.
Q₃ = 8th item + 0.25 × (9th item − 8th item) = 29 + 0.25 × (31 − 29) = 29.5
Interquartile range and quartile deviation.
IQR = Q₃ − Q₁ = 29.5 − 14.25 = 15.25 QD = IQR/2 = 7.625
Quartile conventions differ for listed values; the table above shows this data under each one. For large data sets the differences shrink.
Quartile formulas for each type of series
Quartiles divide ordered data into four parts with equal numbers of observations. How you locate them depends on how the data is given.
Individual series: Qₖ = size of the k(n + 1)/4th item Discrete series: Qₖ = size of the k(N + 1)/4th item (read from the cf column) Continuous series: Qₖ = L + ((kN/4 − cf) / f) × h
Here k is 1, 2 or 3, n is the number of values, N = Σf, L is the lower boundary of the quartile class, cf the cumulative frequency before it, f its frequency and h its width. When a position falls between two items, say the 2.75th, take the 2nd item plus 0.75 of the gap to the 3rd.
Worked example: individual series
The calculator's default data is 23, 15, 31, 8, 26, 12, 38, 17, 29, 21 (n = 10).
- Sorted: 8, 12, 15, 17, 21, 23, 26, 29, 31, 38.
- Q₁ is the (10 + 1)/4 = 2.75th item: 12 + 0.75 × (15 − 12) = 14.25.
- Q₂ is the 5.5th item: 21 + 0.5 × (23 − 21) = 22.
- Q₃ is the 3 × 11/4 = 8.25th item: 29 + 0.25 × (31 − 29) = 29.5.
The interquartile range is 29.5 − 14.25 = 15.25, and the quartile deviation is half of that, 7.625.
Worked example: continuous series
Switch the data type to continuous to load this table (N = 50):
| Class | f | cf |
|---|---|---|
| 0-10 | 5 | 5 |
| 10-20 | 8 | 13 |
| 20-30 | 12 | 25 |
| 30-40 | 15 | 40 |
| 40-50 | 6 | 46 |
| 50-60 | 4 | 50 |
- Q₁: N/4 = 12.5. The first cf of at least 12.5 is 13, so the class is 10-20. Q₁ = 10 + ((12.5 − 5)/8) × 10 = 19.375.
- Q₂: 2N/4 = 25, reached exactly at the end of 20-30. Q₂ = 20 + ((25 − 13)/12) × 10 = 30.
- Q₃: 3N/4 = 37.5, in 30-40. Q₃ = 30 + ((37.5 − 25)/15) × 10 = 38.33.
For the default discrete table (x = 10 to 60 with f = 4, 7, 15, 8, 7, 2, so N = 43) the positions are the 11th, 22nd and 33rd items, and the quartiles are 20, 30 and 40.
Which method? Textbook, Excel and calculators disagree
There is no single agreed definition of a quartile for listed values. The three in common use give different answers on small data sets:
| Method | Used by | Q₁ | Q₃ |
|---|---|---|---|
| (n + 1)/4 position, interpolated | NCERT and most Indian textbooks, Excel QUARTILE.EXC, Minitab | 14.25 | 29.5 |
| 1 + (n − 1)/4 position, interpolated | Excel QUARTILE.INC, Google Sheets, R's default | 15.5 | 28.25 |
| Median of each half | TI-84, many US school texts | 15 | 29 |
The figures are for the default data above. For an exam, use the method your syllabus teaches: the (n + 1) rule for NCERT-based and most B.Com papers. The gap between methods shrinks as n grows, and for grouped data everyone uses the same class-interval formula. One caution: Excel's QUARTILE.EXC returns an error when the position falls before the first item or after the last; this calculator uses the smallest or largest value instead and says so.
Common mistakes
- Not sorting first. Positions only mean something in ascending order.
- Using (N + 1)/4 for class intervals. The grouped formula uses N/4, because it treats the data as spread continuously through each class.
- Taking the cf of the quartile class itself. In the formula, cf is the cumulative frequency of the class before the quartile class.
- Using class limits instead of boundaries. For inclusive classes such as 10-19, L must be 9.5, not 10.
Quartiles feed straight into the quartile deviation and the interquartile range, which measure spread without being pulled about by extreme values.
Common questions
What are Q1, Q2 and Q3?
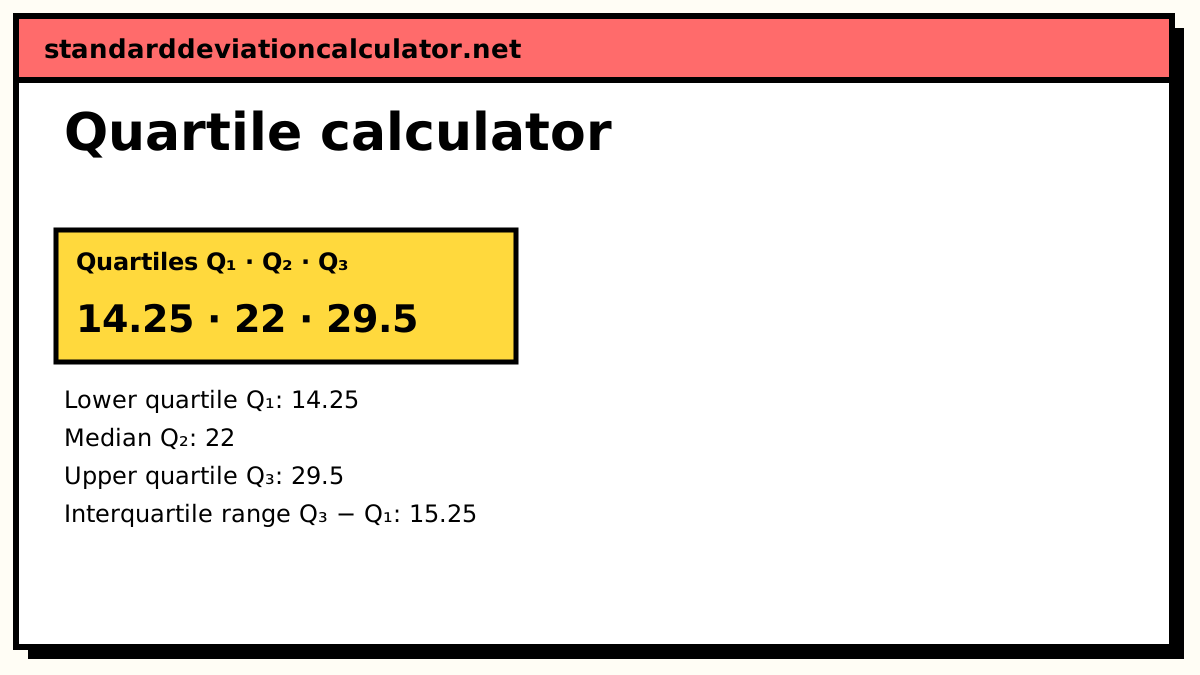
The three values that split ordered data into four equal parts. A quarter of the observations lie below the lower quartile Q₁, half below the median Q₂, and three quarters below the upper quartile Q₃. For the default data on this page they are 14.25, 22 and 29.5.
What is the formula for quartiles of grouped data?
Qₖ = L + ((kN/4 − cf) / f) × h, where L is the lower boundary of the
quartile class, N the total frequency, cf the cumulative frequency of the class before the
quartile class, f the frequency of the quartile class and h its width. The quartile class
is the first class whose cumulative frequency is at least kN/4. Note that grouped data uses
kN/4, not k(N + 1)/4.
Why does my answer differ from Excel?
Excel's QUARTILE.INC (and the older QUARTILE) places Q₁ at
position 1 + (n − 1)/4, while Indian textbooks and QUARTILE.EXC use (n + 1)/4.
For 8, 12, 15, 17, 21, 23, 26, 29, 31, 38 the textbook Q₁ is 14.25 and Excel's
QUARTILE.INC gives 15.5. Neither is wrong; they are different conventions. Pick the one
your course or software uses from the method list.
Do inclusive classes like 10-19, 20-29 need to be converted?
Yes. The formula needs class boundaries with no gaps, so subtract half the gap from each lower limit and add it to each upper limit: 10-19 becomes 9.5-19.5. The calculator does this automatically and says so above the result.
Is the second quartile the same as the median?
Yes. Q₂ is the median, the 50th percentile and the fifth decile D₅. Whatever method you use for the other quartiles, Q₂ comes out the same for listed values.
How do I find quartiles in a discrete series?
Write the cumulative frequencies, find the position k(N + 1)/4, and take the value of x whose cumulative frequency is the first one equal to or greater than that position. With N = 43 in the example below, Q₁ is the 11th item, and the cumulative frequency reaches 11 at x = 20.
Related calculators
-
Quartile deviation
Half the interquartile range, and its coefficient.
-
Decile calculator
D1 to D9 for individual, discrete and grouped data.
-
IQR calculator
The interquartile range with outlier fences.
-
Five-number summary
Minimum, quartiles and maximum as a box plot.
-
Percentile calculator
Any percentile of a list of values.