Statistics
Percentile rank calculator
Enter your data and a value to see what percentage of the data lies below it, or enter a rank to get the value at that percentile. The three common ways of counting tied values are shown side by side.
Separate with commas, spaces or new lines.
Exclusive classes (10-20, 20-30) or inclusive classes (10-19, 20-29). Inclusive classes are converted to class boundaries.
below x (B = 9) equal to x (E = 3) above x (8)
| Convention | Formula | Percentile rank |
|---|---|---|
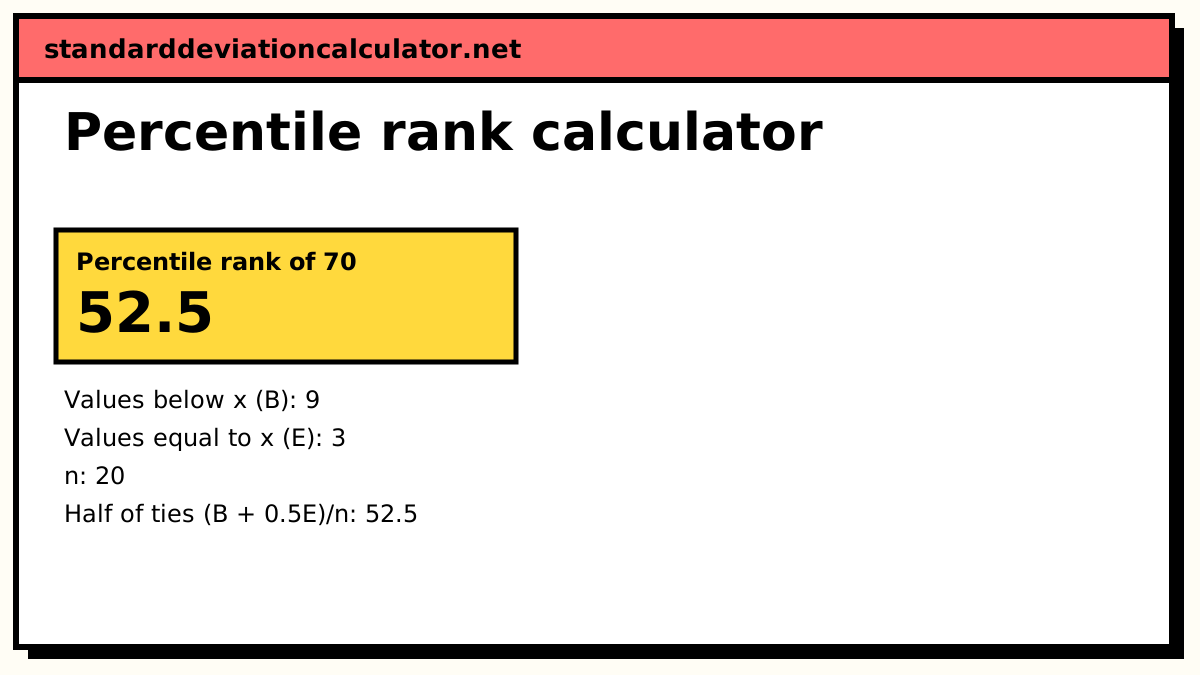
| Half of the ties (mid-rank) | (B + 0.5E)/n × 100 | 52.5 |
| Strictly below | B/n × 100 | 45 |
| At or below (cumulative percentage) | (B + E)/n × 100 | 60 |
| Excel PERCENTRANK.INC | B/(n − 1) × 100 | 47.37 |
Show the working, step by step
Sort the data and count the values below 70 (B) and equal to it (E).
45, 52, 55, 58, 60, 62, 65, 65, 68, 70, 70, 70, 72, 75, 78, 80, 84, 88, 91, 95 B = 9, E = 3, n = 20
Apply (B + 0.5E)/n × 100.
PR = (9 + 0.5 × 3)/20 × 100 = 52.5
A percentile rank of 52.5 means 70 is at or above about 52.5% of this data set. The three conventions agree when x occurs once and n is large.
Percentile rank formulas
For a list of n values, with B values below x and E values equal to x:
Half of the ties (mid-rank): PR = (B + 0.5E) / n × 100 Strictly below: PR = B / n × 100 At or below: PR = (B + E) / n × 100
For grouped data, with x in a class of lower boundary L, width h and frequency f:
PR = (cf + ((x − L) / h) × f) / N × 100
The three list formulas agree when x occurs once and n is large. They differ most in small data sets with repeated values, such as test marks.
Worked example
The default data are 20 test scores:
45, 52, 55, 58, 60, 62, 65, 65, 68, 70, 70, 70, 72, 75, 78, 80, 84, 88, 91, 95.
What is the percentile rank of 70?
- Values below 70: 45, 52, 55, 58, 60, 62, 65, 65, 68, so B = 9.
- Values equal to 70: E = 3. n = 20.
- PR = (9 + 0.5 × 3)/20 × 100 = 10.5/20 × 100 = 52.5.
Strictly below, the rank is 9/20 × 100 = 45; at or below, it is 12/20 × 100 = 60. A score of 88, which occurs once, has rank (17 + 0.5)/20 × 100 = 87.5.
The value at a given rank
Switch “Find” to the value at a percentile rank to go the other way. For the 75th percentile
of the same scores, the textbook rule takes the 0.75 × (20 + 1) = 15.75th item:
78 + 0.75 × (80 − 78) = 79.5. Excel's PERCENTILE.INC uses
position 1 + 0.75 × 19 = 15.25 and gives 78.5, and the nearest-rank rule takes the
⌈0.75 × 20⌉ = 15th item, 78.
Grouped data example
With the continuous series selected, the calculator loads marks in classes 40-50 to 90-100 with frequencies 3, 4, 5, 4, 2, 2 (N = 20). A mark of 75 lies in 70-80, halfway through the class. Twelve students scored below 70, and half of the 4 in the class are assumed to be below 75, so PR = (12 + 2)/20 × 100 = 70.
Interpreting a percentile rank
- A rank of 52.5 means the value is higher than roughly half of the group. It says nothing about the score itself: 52.5 is not a mark out of 100.
- Ranks are relative to this data set only. The same score can have a very different rank in a stronger or weaker group.
- Equal gaps in rank are not equal gaps in score. Near the middle of a bell-shaped distribution a few marks move the rank a lot; in the tails they barely move it.
Common mistakes
- Confusing percentile rank with percentage marks.
- Forgetting ties. With many repeated values the choice of rule changes the answer by several points, so state which one you used.
- Dividing by the number of distinct values instead of n.
Common questions
What is the formula for percentile rank?
The most common one is PR = (B + 0.5E) / n × 100, where B is the number of
values below x, E the number equal to x and n the total. Counting half of the ties puts a
value in the middle of its own group, so the lowest and highest values get ranks
symmetrically placed around 50.
What is the difference between a percentile and a percentile rank?
They are inverses. A percentile is a value: the 75th percentile of the default data is 79.5. A percentile rank is a percentage: the value 70 has a percentile rank of 52.5. This page does both; the percentile calculator lists many percentiles at once.
Why do different calculators give different percentile ranks?
Because they count ties differently. For 70 in the default data (9 values below, 3 equal,
20 in all) the half-ties rule gives 52.5, “strictly below” gives 45 and “at or below” gives
60. Excel's PERCENTRANK.INC uses yet another rule, B/(n − 1), which gives
9/19 = 0.473. Choose the convention your course or report uses.
How do I calculate percentile rank for grouped data?
Find the class containing x and assume its observations are spread evenly through it:
PR = (cf + ((x − L)/h) × f) / N × 100, with cf the cumulative frequency before
the class, L its lower boundary, h its width and f its frequency. For x = 75 in the class
70-80 (cf before 12, f = 4, N = 20): (12 + 0.5 × 4)/20 × 100 = 70.
Can a percentile rank be 100?
Under the half-ties or strictly-below rules, no value in the data reaches 100: the maximum of 20 distinct values has rank 97.5 or 95. Under “at or below” the maximum always has rank 100. For grouped data, any value at or above the top class boundary has rank 100.
Related calculators
-
Percentile calculator
The 5th to 99th percentiles of a list.
-
Z-score calculator
A percentile from a normal curve instead of the data.
-
Decile calculator
The 10th, 20th … 90th percentiles, grouped or raw.
-
Quartile calculator
The 25th, 50th and 75th percentiles.