Statistics
Decile calculator
Choose a decile and enter your data as a list, a frequency table or class intervals. The calculator locates the decile class or position, shows the substitution into the formula, and lists all nine deciles for comparison.
Separate with commas, spaces or new lines.
Exclusive classes (10-20, 20-30) or inclusive classes (10-19, 20-29). Inclusive classes are converted to class boundaries.
Grouped (continuous) data always uses the class-interval formula.
| Decile | Percentile | Value |
|---|---|---|
| D₁ | P₁₀ | 10 |
| D₂ | P₂₀ | 16.25 |
| D₃ | P₃₀ | 21.6667 |
| D₄ | P₄₀ | 25.8333 |
| D₅ | P₅₀ | 30 |
| D₆ | P₆₀ | 33.3333 |
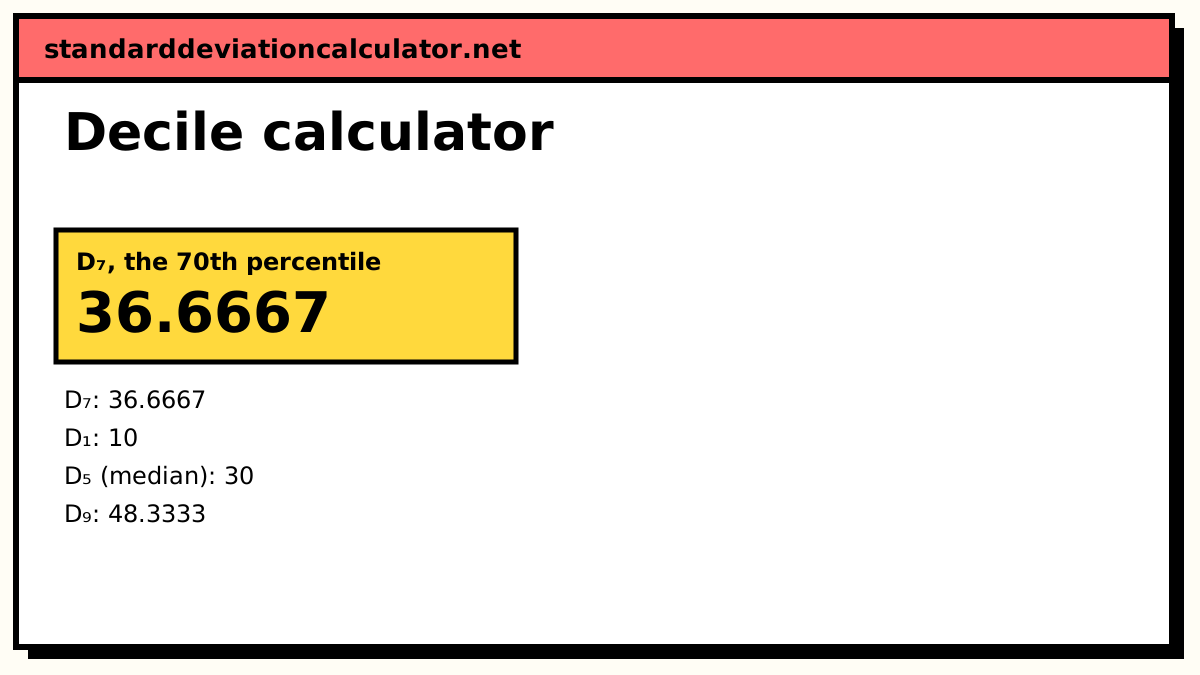
| D₇ | P₇₀ | 36.6667 |
| D₈ | P₈₀ | 40 |
| D₉ | P₉₀ | 48.3333 |
| Class | f | cf | Contains |
|---|---|---|---|
| 0-10 | 5 | 5 | |
| 10-20 | 8 | 13 | |
| 20-30 | 12 | 25 | |
| 30-40 | 15 | 40 | D₇ |
| 40-50 | 6 | 46 | |
| 50-60 | 4 | 50 | |
| N | 50 |
Less-than ogive. The marked points are read off at cumulative frequencies 35.
Show the working, step by step
Add a cumulative frequency (cf) column. N = Σf = 50.
0–10: f = 5, cf = 5 10–20: f = 8, cf = 13 20–30: f = 12, cf = 25 30–40: f = 15, cf = 40 40–50: f = 6, cf = 46 50–60: f = 4, cf = 50
D₇ class: 7N/10 = 7 × 50/10 = 35. The first cumulative frequency ≥ 35 is 40, so the D₇ class is 30–40.
D₇ = L + ((7N/10 − cf) / f) × h = 30 + ((35 − 25) / 15) × 10 = 36.6667
D₇ is the value below which 70% of the observations lie. L is the lower boundary of the decile class, cf the cumulative frequency of the class before it, f its frequency and h its width.
Decile formulas
Individual series: Dₖ = size of the k(n + 1)/10th item Discrete series: Dₖ = size of the k(N + 1)/10th item (from the cf column) Continuous series: Dₖ = L + ((kN/10 − cf) / f) × h
k runs from 1 to 9. L is the lower boundary of the decile class, cf the cumulative frequency of the class before it, f the frequency of the decile class and h its width. The method is the same as for quartiles and the median, with 10 in place of 4 or 2.
Worked example: D₇ of a grouped distribution
The calculator opens on this table (N = 50), finding D₇:
| Class | f | cf |
|---|---|---|
| 0-10 | 5 | 5 |
| 10-20 | 8 | 13 |
| 20-30 | 12 | 25 |
| 30-40 | 15 | 40 |
| 40-50 | 6 | 46 |
| 50-60 | 4 | 50 |
- 7N/10 = 7 × 50/10 = 35.
- The first cumulative frequency of at least 35 is 40, so the D₇ class is 30-40: L = 30, cf = 25, f = 15, h = 10.
- D₇ = 30 + ((35 − 25)/15) × 10 = 30 + 6.667 = 36.67.
So 70% of the 50 observations are below about 36.67. The same table gives D₁ = 10, D₂ = 16.25, D₃ = 21.67, D₄ = 25.83, D₅ = 30, D₆ = 33.33, D₈ = 40 and D₉ = 48.33.
Worked example: individual series
For the ten values 23, 15, 31, 8, 26, 12, 38, 17, 29, 21, sorted to 8, 12, 15,
17, 21, 23, 26, 29, 31, 38, D₇ is the 7(10 + 1)/10 = 7.7th item: 26 + 0.7 × (29 − 26) =
28.1. D₁ is the 1.1th item, 8 + 0.1 × 4 = 8.4, and D₉ the 9.9th item,
31 + 0.9 × 7 = 37.3.
Spreadsheets use a different convention. Excel's PERCENTILE.INC(range, 0.7)
places D₇ at position 1 + 0.7 × (n − 1) = 7.3 and returns 26.9, while
PERCENTILE.EXC matches the textbook 28.1. Pick the method in the calculator to
match your source. With only ten values, D₁ and D₉ sit very close to the ends of the data, so
treat them with caution.
Where deciles are used
- Income and wealth. Household surveys report the income at each decile, and the ratio D₉/D₁ as a simple inequality measure.
- Test scores. Score reports often say which decile a candidate falls in, which is easier to read than a raw mark.
- Spread. D₉ − D₁ covers the middle 80% of the data; half of it is the decile deviation.
Common mistakes
- Using k(N + 1)/10 for class intervals. The grouped formula uses kN/10.
- Taking cf of the decile class itself instead of the class before it.
- Leaving inclusive classes (10-19, 20-29) unconverted. L must be the lower boundary, 9.5, 19.5 and so on; the calculator converts them automatically.
Common questions
What is a decile?
Deciles are the nine values that split ordered data into ten equal parts. D₁ has 10% of the observations below it, D₂ has 20%, and so on up to D₉ with 90%. D₅ is the median.
What is the decile formula for grouped data?
Dₖ = L + ((kN/10 − cf) / f) × h. Find kN/10, locate the first class whose
cumulative frequency is at least that, and use its lower boundary L, frequency f and width
h, with cf the cumulative frequency of the class before it.
How do I find a decile of ungrouped data?
Sort the values and take the k(n + 1)/10th item. For D₇ of 10 values that is the 7.7th item: the 7th value plus 0.7 of the gap to the 8th. In a discrete series, use k(N + 1)/10 and read the value of x whose cumulative frequency first reaches that position.
How are deciles related to percentiles and quartiles?
Dₖ is the same as the (10k)th percentile: D₁ = P₁₀, D₅ = P₅₀ = Q₂ = median, D₉ = P₉₀. Quartiles and deciles only coincide at the median. For other percentiles, use the percentile calculator.
What does it mean to be in the top decile?
Your value is above D₉, so you are in the highest 10% of the group. Income statistics often compare the top decile with the bottom one (below D₁), as a ratio D₉/D₁, to describe inequality.
Related calculators
-
Decile deviation
Spread of the middle 80%: (D9 − D1)/2.
-
Quartile calculator
Q1, Q2 and Q3 for the same three series types.
-
Percentile calculator
Any percentile from a list of values.
-
Percentile rank
Where a single value sits in the data.