Math
Minimum and maximum calculator
The minimum is the smallest value in a data set and the maximum is the largest. Paste a list of any length to find both, see how many times each occurs, and get the next values in from each end.
Separate numbers with commas, spaces or new lines, or paste a spreadsheet column.
Decimals and negatives are fine; write 10:3 for a value that occurs 3 times.
Your results will appear here: the result first, then the rest of the summary and a chart.
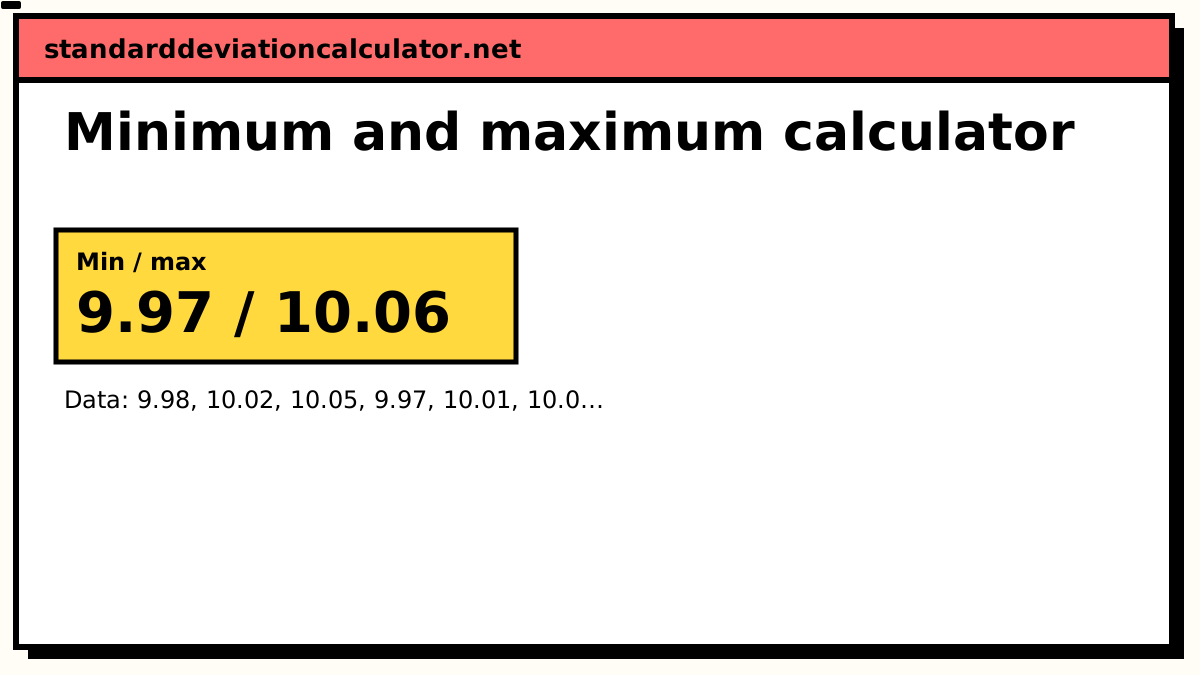
Minimum / maximum
9.97 / 10.06
Data distribution
Shaded bands mark ±1, ±2 and ±3 SD from the mean. 7 of 12 values (58%) fall within ±1 SD.
Chart as text
Mean 10.0117, sample standard deviation s = 0.0304014, from 12 values between 9.97 and 10.06.
- Within ±1 SD (9.981 to 10.04): 7 of 12 values (58%). About 68% for normal data.
- Within ±2 SD: 12 (100%). About 95% for normal data.
- Within ±3 SD: 12 (100%). About 99.7% for normal data.
Show the working, step by step
What the calculator reports
- Minimum and maximum, with a count when the value is tied (for example ×2).
- Second smallest and second largest, the equivalent of Excel's
SMALL(…,2)andLARGE(…,2). - Midrange, (min + max) ÷ 2, and the range, max − min.
- The mean, median and standard deviation, so you can judge how far out the extremes are.
A worked example: checking parts against a specification
Twelve machined shafts are measured, in millimetres, against a specification of 10.00 ± 0.05 mm — a lower limit of 9.95 and an upper limit of 10.05. The readings are the ones loaded above.
- Sorted: 9.97, 9.97, 9.98, 9.99, 10.00, 10.01, 10.02, 10.02, 10.03, 10.04, 10.05, 10.06.
- Minimum = 9.97, which occurs twice. It is 0.02 mm inside the lower limit.
- Maximum = 10.06. It is above the upper limit of 10.05, so one part fails.
- The second largest is 10.05 — exactly on the limit, which passes if the limit is inclusive.
- Midrange = (9.97 + 10.06) ÷ 2 = 10.015; range = 0.09 mm.
Checking the extremes is the fastest pass/fail test: if the minimum and maximum are inside the limits, every value is. It does not tell you how close the process is to failing next time. For that, use the mean (10.0117) and standard deviation (0.0304) in the Cpk calculator.
Midrange, mean and median
The midrange is a centre built from the two extremes. It is quick, and for data spread evenly between two limits it works well. For almost anything else it is the least stable of the three centres, because a single extreme value moves it by half its own distance. In the example the midrange (10.015), mean (10.0117) and median (10.015) agree closely because the readings are spread fairly evenly; one bad reading of 10.30 would push the midrange to 10.135 while the median would barely move.
Minimum and maximum in Excel and Google Sheets
| What you want | Formula |
|---|---|
| Minimum | =MIN(A2:A13) |
| Maximum | =MAX(A2:A13) |
| Second smallest | =SMALL(A2:A13,2) |
| Second largest | =LARGE(A2:A13,2) |
| How many times the minimum occurs | =COUNTIF(A2:A13,MIN(A2:A13)) |
| Minimum of one group (label in B) | =MINIFS(A2:A13,B2:B13,"Line 1") |
| Values above an upper limit in D1 | =COUNTIF(A2:A13,">"&D1) |
| Midrange | =(MIN(A2:A13)+MAX(A2:A13))/2 |
MIN and MAX ignore text and blank cells in a range, but a number stored as text is ignored too, so a column imported from another system can give a minimum that is silently wrong. Pasting the column into the calculator reports any entry that is not a number.
Is the maximum an outlier?
Every data set has a maximum, so being the largest value says nothing about being unusual. Compare it with the rest: how many standard deviations above the mean it sits, or whether it falls outside Tukey's fences at Q3 + 1.5 × IQR. The outlier calculator runs both checks, plus Grubbs' test.
Related calculators
-
Range calculator
Max minus min as a measure of spread, compared with the IQR and SD.
-
Cpk & process capability
How comfortably a process sits inside its specification limits.
-
Five-number summary
Min and max together with the quartiles and median.
-
Outlier calculator
Check whether an extreme value is an outlier or just the end of the data.
Common questions
How do I find the minimum and maximum of a list of numbers?
Sort the list: the minimum is the first value and the maximum the last. For a long list,
paste it into the calculator above, or use =MIN(A:A) and =MAX(A:A)
in a spreadsheet.
What if the smallest value appears more than once?
The minimum is still that value — a tie does not change it. The calculator marks ties,
for example 9.97 (×2). In Excel, =COUNTIF(A2:A13,MIN(A2:A13))
counts how many times the minimum occurs.
What is the midrange?
The point halfway between the minimum and maximum: (min + max) ÷ 2. It is a
quick estimate of the centre, but it depends on only the two most extreme values, so it is
much more sensitive to outliers than the mean or median.
How do I find the second smallest or second largest value?
In Excel and Google Sheets use =SMALL(A2:A13,2) and =LARGE(A2:A13,2).
Both count ties as separate values, so if the minimum appears twice, SMALL(…,2) returns the
minimum again. The calculator reports them the same way.
Are negative numbers and decimals allowed?
Yes. With negatives, the minimum is the most negative value: the minimum of −3, −10 and 2 is −10, not −3.