Coefficient of variation calculator
The coefficient of variation (CV = s ÷ x̄) expresses spread relative to the mean, which makes variability comparable across datasets measured in different units or at very different magnitudes.
Separate numbers with commas, spaces or new lines, or paste a spreadsheet column.
Decimals and negatives are fine; write 10:3 for a value that occurs 3 times.
Your results will appear here: the standard deviation first, then the rest of the summary and a chart.
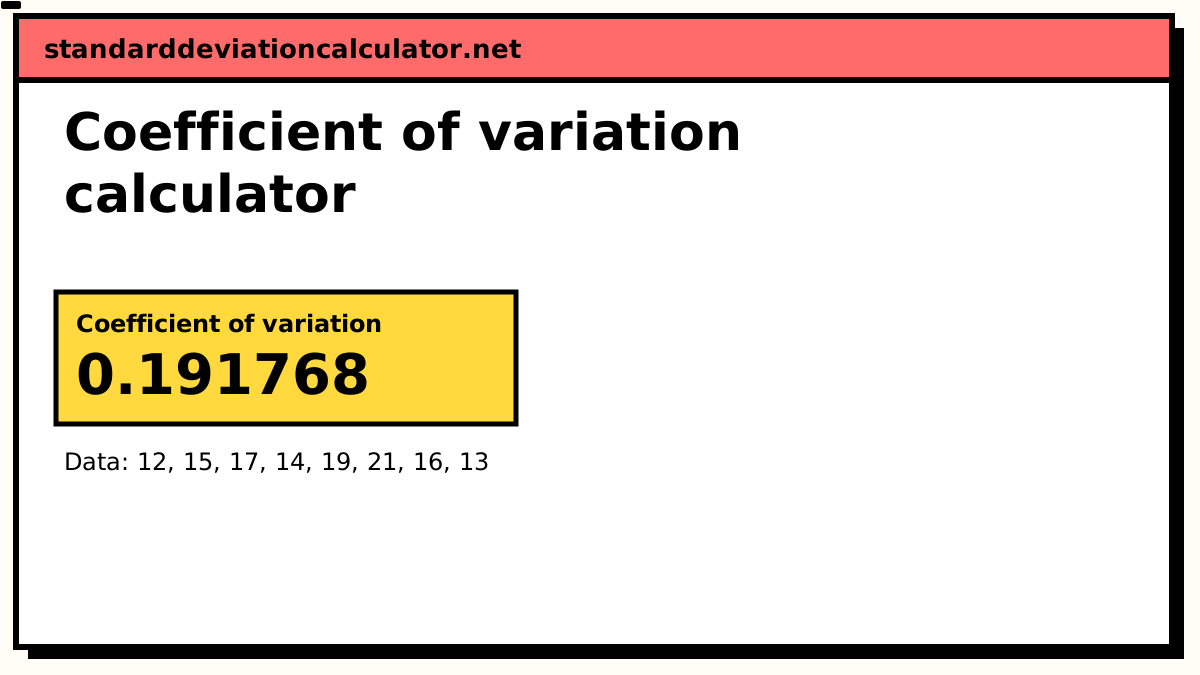
Coefficient of variation
0.191768
The standard deviation (3.044) is 19.2% of the mean (15.88). Because it has no units, this figure can be compared across datasets measured on different scales.
- Count (n)
- 8
- Mean (x̄)
- 15.875
- Standard deviation (s)
- 3.04432
- Relative SD (%RSD)
- 19.1768%
- Minimum
- 12
- Q1 (25%)
- 13.75
- Median
- 15.5
- Q3 (75%)
- 17.5
- Maximum
- 21
- Range
- 9
More statistics (5)
- Variance (s²)
- 9.26786
- Standard error
- 1.07633
- Sum (Σx)
- 127
- Sum of squares, Σ(x − x̄)²
- 64.875
- IQR (Q3 − Q1)
- 3.75
Data distribution
Shaded bands mark ±1, ±2 and ±3 SD from the mean. 5 of 8 values (63%) fall within ±1 SD.
Chart as text
Mean 15.875, sample standard deviation s = 3.04432, from 8 values between 12 and 21.
- Within ±1 SD (12.83 to 18.92): 5 of 8 values (63%). About 68% for normal data.
- Within ±2 SD: 8 (100%). About 95% for normal data.
- Within ±3 SD: 8 (100%). About 99.7% for normal data.
Show the working, step by step
Coefficient of variation formula
CV = s / x̄ %CV = 100 × s / |x̄|
Because both numerator and denominator carry the units of the data, they cancel: a CV is a dimensionless ratio. That is the entire point of the statistic, and also the source of its limitations.
Why relative spread is sometimes the only fair comparison
Suppose you are comparing the consistency of two production lines. Line A makes components with a mean mass of 2 g and an SD of 0.1 g. Line B makes components with a mean mass of 500 g and an SD of 5 g.
| Line | Mean | SD | CV | %CV |
|---|---|---|---|---|
| A | 2 g | 0.1 g | 0.050 | 5.0% |
| B | 500 g | 5 g | 0.010 | 1.0% |
Line B's standard deviation is fifty times larger, and Line B is nonetheless five times more consistent in the sense that matters: its parts deviate far less as a proportion of their intended size. Only the CV surfaces that.
Where the CV misleads
- Means near zero. The CV is a ratio with the mean underneath, so it grows without bound as the mean approaches zero and is undefined at exactly zero. Small means make it unstable long before it becomes undefined.
- Interval scales. The mean of a set of Celsius temperatures depends on an arbitrary zero point, so a percentage of it means nothing. The same data converted to kelvin gives a completely different CV, which shows the number was never real.
- Data that can be negative. Returns, profit and loss, deviations from target: the mean can sit anywhere, including near zero, so the CV is meaningless.
- Small samples. With few observations the CV is estimated so imprecisely that comparing two of them is rarely justified.
CV in Excel
There is no built-in function; construct it from the two you have:
=STDEV.S(A1:A20)/AVERAGE(A1:A20) ratio =STDEV.S(A1:A20)/AVERAGE(A1:A20)*100 percentage
Use STDEV.P if the values are a complete population, and wrap the
AVERAGE in ABS() if the mean might be negative, although if it
might be negative, the CV is probably the wrong statistic.
More Excel formulas here.
Related calculators
-
Relative SD (%RSD)
The same statistic in its laboratory form.
-
Standard deviation calculator
The absolute spread in the numerator.
-
Variance calculator
Spread before the square root.
-
Standard error
Precision of the mean rather than spread of the data.
Common questions
What is the coefficient of variation?
The standard deviation divided by the mean: CV = s / x̄. Because the units
cancel it is a pure number, which lets you compare variability between datasets measured on
different scales.
Is CV the same as relative standard deviation?
Yes: the same calculation under two names. %RSD is the convention in analytical chemistry and quality control and is always given as a percentage; CV is the statistics and finance convention and is often left as a decimal. The RSD page covers the laboratory context.
What is a good coefficient of variation?
Entirely field-dependent. In analytical chemistry a CV above 2% may fail a method specification; in ecology or economics a CV of 50% can be unremarkable. There is no universal threshold; compare against typical values for your own domain.
When should I not use CV?
When the mean is near zero, when the data can be negative, or when the measurement scale has an arbitrary zero point such as Celsius. In all three cases dividing by the mean produces a number that looks meaningful and is not.