Statistics
Population variance calculator (σ²)
Enter every value in the group to get its population variance, σ² — the average squared distance from the mean, dividing by N. The calculator opens in population mode; the sample figure is shown beside it for comparison.
Separate numbers with commas, spaces or new lines, or paste a spreadsheet column.
Decimals and negatives are fine; write 10:3 for a value that occurs 3 times.
Your results will appear here: the standard deviation first, then the rest of the summary and a chart.
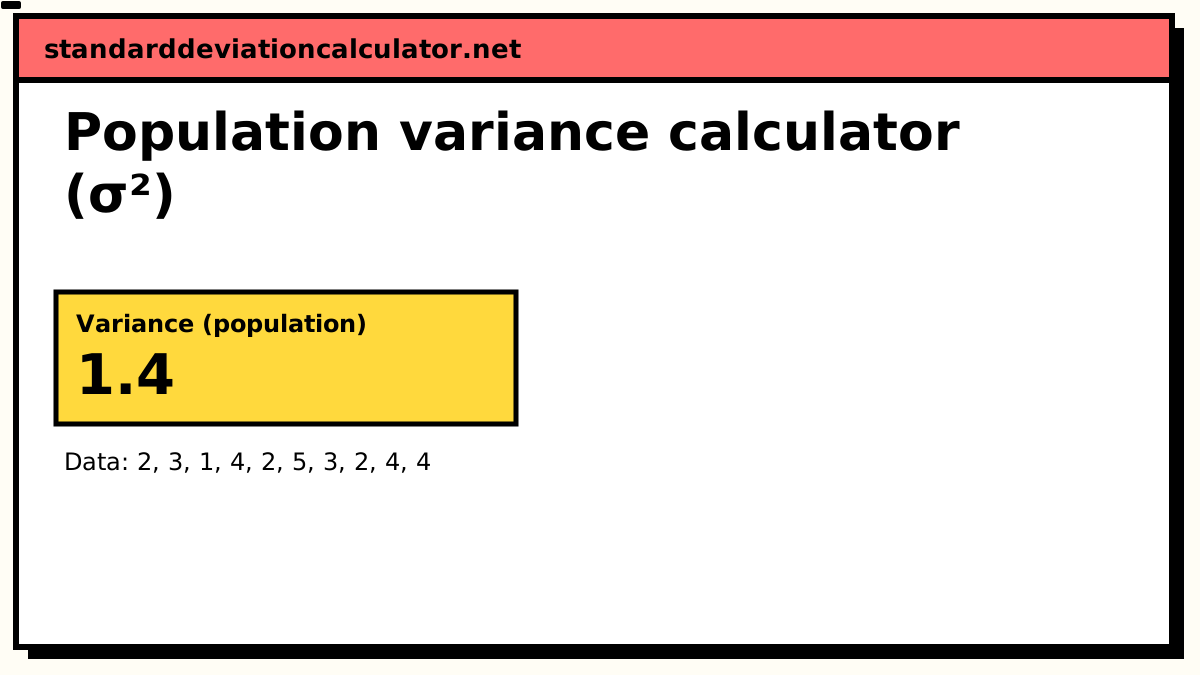
Variance (population)
1.4
1.40
The variance is in squared units, so it is hard to read on its own. Its square root is the standard deviation, 1.183: your values typically sit about that far above or below their mean of 3.
Sample variance (s²): 1.55556, if these values are a sample from a larger group.
- Count (n)
- 10
- Mean (x̄)
- 3
- Standard deviation (σ)
- 1.18322
- Standard error
- 0.374166
- Minimum
- 1
- Q1 (25%)
- 2
- Median
- 3
- Q3 (75%)
- 4
- Maximum
- 5
- Range
- 4
More statistics (5)
- Relative SD (%RSD)
- 39.4405%
- Coefficient of variation
- 0.394405
- Sum (Σx)
- 30
- Sum of squares, Σ(x − x̄)²
- 14
- IQR (Q3 − Q1)
- 2
Data distribution
Shaded bands mark ±1, ±2 and ±3 SD from the mean. 8 of 10 values (80%) fall within ±1 SD.
Chart as text
Mean 3, population standard deviation σ = 1.18322, from 10 values between 1 and 5.
- Within ±1 SD (1.817 to 4.183): 8 of 10 values (80%). About 68% for normal data.
- Within ±2 SD: 10 (100%). About 95% for normal data.
- Within ±3 SD: 10 (100%). About 99.7% for normal data.
Show the working, step by step
The population variance formula
σ² = Σ(x − μ)² / N
Every value contributes its squared distance from the population mean μ, and the total is divided by N, the number of values. Nothing is being estimated, so there is no correction term: this is simply the mean of the squared deviations.
A worked example
A building has ten flats, and the household sizes are
2, 3, 1, 4, 2, 5, 3, 2, 4, 4. The landlord wants to describe these ten
households, not households in general, so the data is a population.
- ΣX = 30 people over N = 10 flats, so μ = 3.
- Deviations: −1, 0, −2, 1, −1, 2, 0, −1, 1, 1.
- Squared and added: Σ(x − μ)² = 1 + 0 + 4 + 1 + 1 + 4 + 0 + 1 + 1 + 1 = 14.
- Divide by N = 10: σ² = 1.4 people².
- The population standard deviation is √1.4 = 1.18322 people.
The computational (shortcut) formula
Expanding the square gives a version that needs only the sum of the values and the sum of their squares:
σ² = Σx² / N − μ²
For the flats, Σx² = 4 + 9 + 1 + 16 + 4 + 25 + 9 + 4 + 16 + 16 = 104, so σ² = 104 / 10 − 3² = 10.4 − 9 = 1.4 — the same answer. The shortcut is how the variance was computed by hand and on early calculators, and it is the form you meet in probability as Var(X) = E[X²] − (E[X])².
It has one real weakness. When the values are large and their spread is small — timestamps, readings like 100,000.1 and 100,000.3 — Σx²/N and μ² are two huge, nearly equal numbers, and subtracting them throws away most of the significant digits. The result can even come out negative. This calculator uses Welford's deviation-based algorithm, which does not have that problem; see the methodology.
Population variance in software
| Tool | Population variance |
|---|---|
| Excel / Google Sheets | =VAR.P(A1:A10) |
| Python (statistics) | statistics.pvariance(x) |
| NumPy | np.var(x) |
| pandas | df['x'].var(ddof=0) |
| R | var(x) * (length(x) - 1) / length(x) |
R has no population variance function, which surprises people moving from Excel. The rescaling in the last row converts its n − 1 result.
Is my data really a population?
The test is what you intend to say with the number. If the statement is about exactly these values — "the household sizes in this building vary by σ² = 1.4" — it is a population. If the statement reaches beyond them — "households in this city vary by about…" — the ten flats are a sample and the sample variance (1.55556 here) is the better estimate. The variance calculator switches between the two, and the sample vs population guide works through common borderline cases.
Related calculators
-
Variance calculator
The general tool, with a sample/population switch.
-
Sample variance
s² with n − 1, for data that stands in for a larger group.
-
Population standard deviation
σ, the square root of this result.
-
Sum of squares
The numerator of every variance, by both formulas.
Common questions
What is the population variance formula?
σ² = Σ(x − μ)² / N, where μ is the population mean and N the number of
values in the population. It is the plain average of the squared deviations.
When should I use population variance instead of sample variance?
When your data contains every member of the group you want to describe, and you are not using it to generalise to a larger group. A teacher's whole class, all twelve months of a year's sales, every unit in a finished batch — these are populations. If the values are a subset standing in for something bigger, use the sample variance.
What is the shortcut formula for population variance?
σ² = Σx² / N − μ²: the mean of the squares minus the square of the mean. It
gives the same answer with one pass through the data, but it can lose precision badly when
the values are large and close together, so calculators (including this one) use the
deviation form internally.
What is the Excel formula for population variance?
=VAR.P(A1:A10). The legacy name is VARP. In NumPy,
np.var(x) with its default settings is already the population variance.
Is population variance always smaller than sample variance?
For the same numbers, yes: σ² = s² × (N − 1)/N, so it is smaller by a factor that approaches 1 as N grows. With 10 values the population variance is 90% of the sample variance; with 1,000 it is 99.9%.