Statistics
Mean and standard deviation calculator
The mean says where your data is centred; the standard deviation says how far individual values typically stray from it. Most reports give them as a pair. Enter your values to get both, with the working shown and the variance and standard error alongside.
Separate numbers with commas, spaces or new lines, or paste a spreadsheet column.
Decimals and negatives are fine; write 10:3 for a value that occurs 3 times.
Your results will appear here: the standard deviation first, then the rest of the summary and a chart.
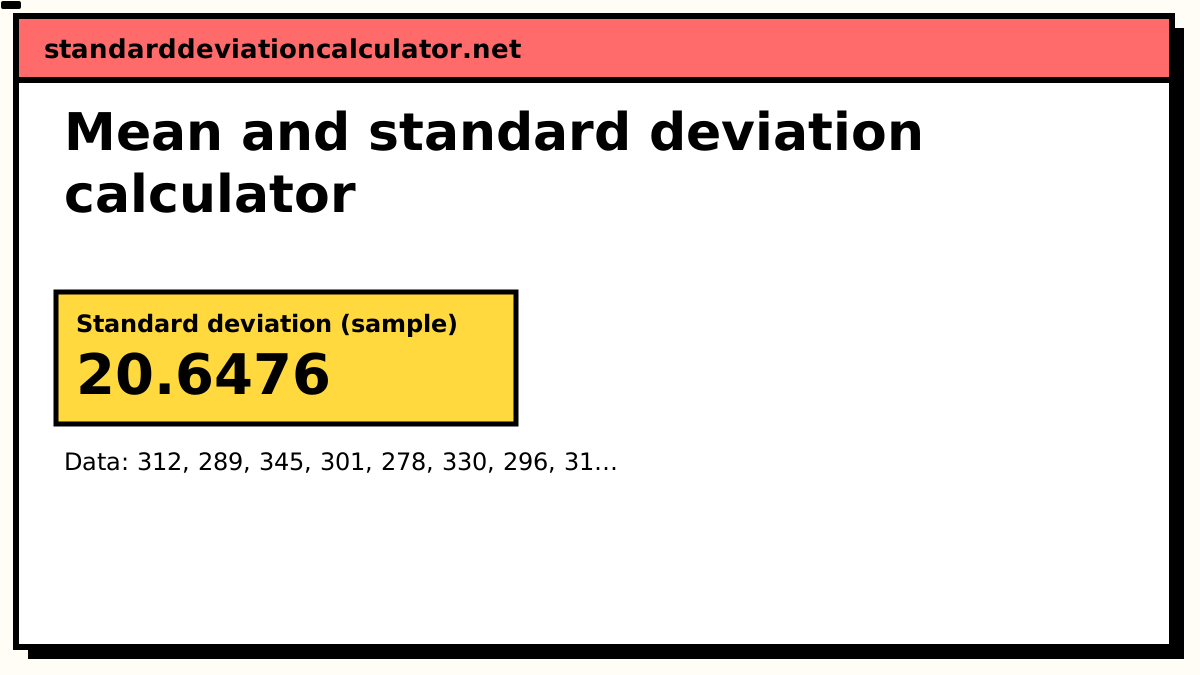
Standard deviation (sample)
20.6476
20.65
Your values typically sit about 20.6 above or below their mean of 306.1, in the same units as your data. 7 of 10 values (70%) fall between 285.5 and 326.7, within one standard deviation of the mean; for normally distributed data about 68% would.
Population SD (σ): 19.588, if these values are the whole group.
- Count (n)
- 10
- Mean (x̄)
- 306.1
- Variance (s²)
- 426.322
- Standard error
- 6.52934
- Minimum
- 278
- Q1 (25%)
- 290.75
- Median
- 303
- Q3 (75%)
- 316.5
- Maximum
- 345
- Range
- 67
More statistics (5)
- Relative SD (%RSD)
- 6.74537%
- Coefficient of variation
- 0.0674537
- Sum (Σx)
- 3061
- Sum of squares, Σ(x − x̄)²
- 3836.9
- IQR (Q3 − Q1)
- 25.75
Data distribution
Shaded bands mark ±1, ±2 and ±3 SD from the mean. 7 of 10 values (70%) fall within ±1 SD.
Chart as text
Mean 306.1, sample standard deviation s = 20.6476, from 10 values between 278 and 345.
- Within ±1 SD (285.5 to 326.7): 7 of 10 values (70%). About 68% for normal data.
- Within ±2 SD: 10 (100%). About 95% for normal data.
- Within ±3 SD: 10 (100%). About 99.7% for normal data.
Show the working, step by step
The two formulas
x̄ = Σx ÷ n s = √( Σ(x − x̄)² ÷ (n − 1) )
The standard deviation is built on the mean: every deviation is measured from
x̄. That is why they belong together — a standard deviation quoted without its
mean has lost its reference point.
A worked example: reaction times
Ten participants' reaction times, in milliseconds:
312, 289, 345, 301, 278, 330, 296, 318, 305, 287.
- Mean: 3061 ÷ 10 = 306.1 ms.
- Squared deviations from 306.1 sum to 3836.9. The slowest participant (345 ms) alone contributes 1513.21 of that.
- Sample variance: 3836.9 ÷ 9 = 426.322 ms².
- Standard deviation: √426.322 = 20.6476 ms.
Reported: M = 306.1 ms, SD = 20.6 ms, or 306.1 ± 20.6 ms with a note saying the ± is one standard deviation.
How to report mean and standard deviation
| Style | Example |
|---|---|
| APA 7, in text | M = 306.1, SD = 20.6 |
| APA 7, in parentheses | (M = 306.1 ms, SD = 20.6) |
| Biomedical journals | 306.1 (20.6) ms, with "mean (SD)" in the methods or table header |
| Engineering, lab reports | 306.1 ± 20.6 ms (mean ± 1 SD, n = 10) |
Three habits make the pair readable: state n, say which standard deviation (sample, in almost every report), and never leave a bare "±" for the reader to guess at. The psychology guide covers APA tables in more detail.
Mean ± SD versus mean ± SE
For the reaction-time data the standard error is 20.6476 ÷ √10 = 6.53 ms. Written as 306.1 ± 6.5 it looks three times more consistent than 306.1 ± 20.6, though it is the same data. The SD describes the participants; the SE describes how well the mean of 306.1 has been estimated. If precision is your point, a confidence interval communicates it better than either. The mean and standard error calculator gives the SE version.
When mean and SD mislead
The pair assumes a roughly symmetric distribution. When data is strongly skewed, or the SD is as large as the mean, the median and interquartile range describe it more honestly — the five-number summary gives them. Check the dot plot above: if the values bunch on one side with a long tail on the other, report both summaries. Standard deviation vs mean explains how the two behave under shifting, rescaling and outliers.
Related calculators
-
Standard deviation calculator
The general calculator, with sample and population modes and a dot plot.
-
Mean and standard error
The pair to report when precision of the mean is the point.
-
Mean and variance
The same summary with the variance promoted.
-
Descriptive statistics
Median, quartiles, skewness and more, all at once.
Common questions
How do I write mean and standard deviation in APA style?
In text, italicise the symbols and give both to the same precision as the data allows: M = 306.10, SD = 20.65. In parentheses, "(M = 306.10, SD = 20.65)". In tables, a column headed M and a column headed SD is clearer than "mean ± SD" in one cell.
What does mean ± SD actually tell a reader?
Where the data is centred and how widely individual values scatter around that centre. For roughly normal data about two thirds of values lie within one SD of the mean and about 95% within two. It says nothing about how precisely the mean itself is known; that is the standard error.
Should I report mean ± SD or mean ± SE?
Use SD when you are describing the people, samples or parts you measured. Use SE (or, better, a confidence interval) when the point is how well the mean has been pinned down. Many journals require SD for descriptive statistics because SE shrinks with sample size and can make noisy data look tidy. Always label which one you used.
How many decimal places should the mean and SD have?
A common rule is one more decimal place than the raw data, and the same number for both. Reaction times recorded in whole milliseconds would be reported as M = 306.1, SD = 20.6. Keep full precision in any later calculation and round only at the end.
Can the standard deviation be larger than the mean?
Yes. It happens with skewed data that has a floor at zero — hospital stays, income, counts of rare events — and with data centred near zero. It is a hint that the mean ± SD summary may be misleading and that the median and quartiles describe the data better.