Statistics
Population standard deviation calculator
The population standard deviation, σ, measures the spread of a complete group:
every member is in the data, so nothing is being estimated. Enter the values below. The
calculator divides by n and shows the sample figure alongside, in case your data turns out to
be a sample after all.
Separate numbers with commas, spaces or new lines, or paste a spreadsheet column.
Decimals and negatives are fine; write 10:3 for a value that occurs 3 times.
Your results will appear here: the standard deviation first, then the rest of the summary and a chart.
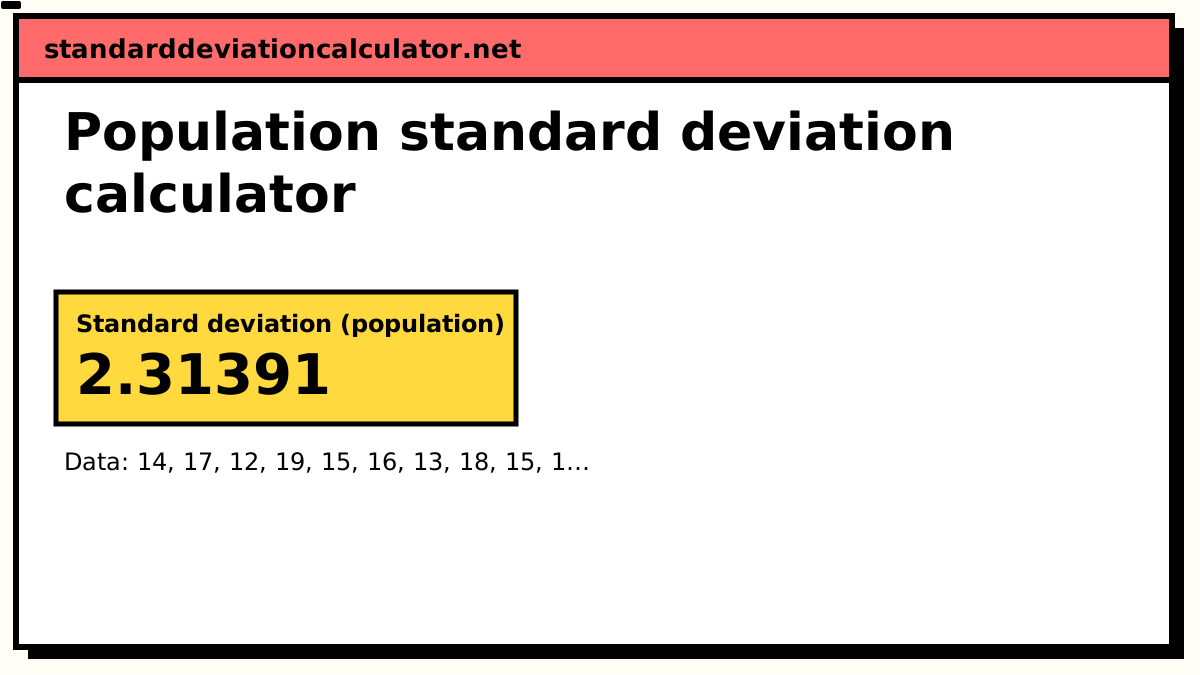
Standard deviation (population)
2.31391
2.31
Your values typically sit about 2.31 above or below their mean of 15.25, in the same units as your data. 8 of 12 values (67%) fall between 12.94 and 17.56, within one standard deviation of the mean; for normally distributed data about 68% would.
Sample SD (s): 2.4168, if these values are a sample from a larger group.
- Count (n)
- 12
- Mean (x̄)
- 15.25
- Variance (σ²)
- 5.35417
- Standard error
- 0.667967
- Minimum
- 11
- Q1 (25%)
- 13.75
- Median
- 15.5
- Q3 (75%)
- 17
- Maximum
- 19
- Range
- 8
More statistics (5)
- Relative SD (%RSD)
- 15.1732%
- Coefficient of variation
- 0.151732
- Sum (Σx)
- 183
- Sum of squares, Σ(x − x̄)²
- 64.25
- IQR (Q3 − Q1)
- 3.25
Data distribution
Shaded bands mark ±1, ±2 and ±3 SD from the mean. 8 of 12 values (67%) fall within ±1 SD.
Chart as text
Mean 15.25, population standard deviation σ = 2.31391, from 12 values between 11 and 19.
- Within ±1 SD (12.94 to 17.56): 8 of 12 values (67%). About 68% for normal data.
- Within ±2 SD: 12 (100%). About 95% for normal data.
- Within ±3 SD: 12 (100%). About 99.7% for normal data.
Show the working, step by step
The population standard deviation formula
σ = √( Σ(x − μ)² ÷ N )
where μ is the population mean and N the number of members. Every
squared deviation is averaged over all N values. There is no n − 1 correction, because the
mean is the true mean of the group rather than an estimate of some larger one.
A worked example: one class's quiz scores
A teacher records the scores of all 12 students in a class on a 20-point quiz:
14, 17, 12, 19, 15, 16, 13, 18, 15, 11, 17, 16. The report is about this class
and no other, so the twelve scores are the population.
- Sum = 183, so μ = 183 ÷ 12 = 15.25.
- Square each score's distance from 15.25. The student who scored 11 contributes (−4.25)² = 18.0625; the two scoring 15 contribute 0.0625 each.
- Add them: Σ(x − μ)² = 64.25.
- Divide by N = 12: σ² = 5.35417.
- Take the square root: σ = 2.31391 points.
Had the teacher treated the class as a sample of all students taking the course, the answer would be s = 2.41680, dividing by 11 instead. Both are loaded above; the result card shows the sample figure beneath the headline.
Real populations, and data that only looks like one
| Data | Population? | Why |
|---|---|---|
| Heights of the 25 players on a roster, describing the roster | Yes | Every member is measured and the claim stops there |
| All 40 batches produced in a closed lot | Yes | The lot is finished; nothing further will be added |
| Monthly sales for every month of 2025 | Yes, for describing 2025 | A sample if used to forecast 2026 |
| 200 survey respondents out of a city | No | The conclusion is about the city |
| Ten repeat measurements of one standard | No | They sample what the instrument would read on repetition |
The test is not how many values there are but what you intend to say about them. The sample vs population guide works through more borderline cases.
Population standard deviation in software
- Excel / Google Sheets:
=STDEV.P(A1:A12) - TI-84:
σxin the 1-Var Stats output - Casio:
σxorxσn - NumPy:
np.std(x)— the default,ddof=0 - pandas:
df['x'].std(ddof=0) - R:
sqrt(mean((x - mean(x))^2)), sincesd()always uses n − 1
For the rest of the population summary, the population variance calculator reports σ² as its headline, and the standard deviation calculator switches freely between the two modes.
Related calculators
-
Sample standard deviation
Dividing by n − 1, for data drawn from a larger group.
-
Population variance
σ², the population spread in squared units.
-
Sample vs population
Which denominator to use, and how much it changes the answer.
-
Standard deviation calculator
The general calculator, with both modes and a dot plot.
Common questions
When is my data a whole population?
When the values you have are every member of the group your conclusion is about, and you are not generalising beyond them. The quiz scores of one class, reported for that class; the fill weights of every bottle in a finished lot; census counts for every county in a state. If you would say "students like these" or "the process in general", it is a sample.
Which Excel function gives the population standard deviation?
=STDEV.P(range). The older STDEVP does the same. Google Sheets
accepts both spellings. STDEV.S and plain STDEV give the sample
version instead.
Is σx on a TI-84 the population standard deviation?
Yes. After 1-Var Stats, σx divides by n and Sx divides by
n − 1. Casio calculators label them σx (or xσn) and
sx (or xσn−1).
Can I use the population formula for a large sample?
You can, and the error is small: with n = 200 the two differ by 0.25%. But it is still the wrong formula for a sample, and there is no benefit to using it, so reports and exams expect n − 1 whenever the data is a sample, however large.
What is the symbol for population standard deviation?
The Greek letter sigma, σ, and its square σ² for the population
variance. The population mean is μ. See the
notation guide for how to type them.