Standard deviation and variance calculators
Every standard deviation and variance calculator on the site, from a quick sample SD of a short list to pooled, weighted and portfolio SDs. Pick the one that matches the shape of your data (a list, a frequency table, several groups or a file) and the answer comes with the steps behind it.
Which calculator do I need?
| You have or want | Use |
|---|---|
| A list of numbers that is a sample from a larger group | Sample standard deviation (s, n − 1) |
| A list that is the entire population, such as every student in one class | Population standard deviation (σ, n) |
| The mean ± SD to report in a paper or lab write-up | Mean and standard deviation |
| A frequency table of values and counts | Frequency table standard deviation |
| Class intervals such as 10–19, 20–29 with frequencies | Grouped data standard deviation |
| Two or more groups whose SDs you want to combine | Pooled standard deviation |
| A spreadsheet column or thousands of values | Standard deviation from CSV data |
| The variance rather than the SD | Variance calculator |
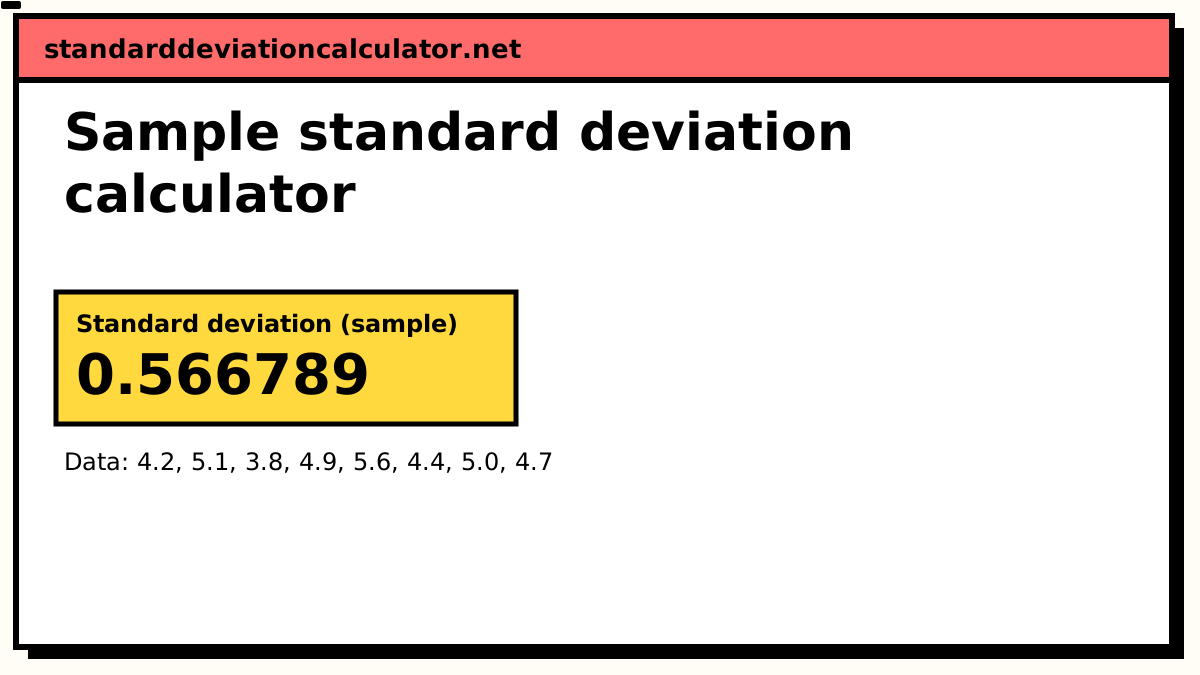
Standard deviation of a list
Paste a list of numbers and get the standard deviation, alone or with the mean, variance and standard error.
-
Standard deviation calculator
Sample and population SD side by side, with the deviations table and every step.
-
Sample standard deviation calculator
The sample SD s with Bessel’s n − 1 correction, as Excel’s STDEV.S gives it.
-
Population standard deviation calculator
The population SD σ dividing by n, as Excel’s STDEV.P gives it.
-
Mean and standard deviation
The mean and SD together, formatted as M ± SD for reports and APA style.
-
Mean, variance and standard deviation
Mean, variance and standard deviation of a list in one table.
-
Standard deviation and standard error
The SD of the values and the standard error of their mean, side by side.
Variance
The square of the standard deviation, for when a formula, ANOVA table or textbook asks for s² or σ².
-
Variance calculator
Sample and population variance, with a converter between variance and SD.
-
Sample variance calculator
The sample variance s² = SS ÷ (n − 1), as VAR.S gives it.
-
Population variance calculator
The population variance σ² = SS ÷ n, as VAR.P gives it.
-
Variance and standard deviation
Variance and standard deviation together, sample and population.
-
Mean and variance calculator
The mean and variance of a list, the first two moments of the data.
-
Sum of squares calculator
The sum of squared deviations Σ(x − x̄)², the numerator of every variance.
Frequency tables, weights and several groups
When the data arrive as counts, class intervals, weights or separate groups rather than one plain list.
-
Frequency table standard deviation
SD from a table of values and how often each occurs.
-
Grouped data standard deviation
SD from class intervals and frequencies, using class midpoints.
-
Weighted standard deviation
SD and weighted mean when each value carries its own weight, with a bias-corrected sample option.
-
Pooled standard deviation
The combined SD of two or more groups, as used in t-tests and Cohen’s d.
-
Portfolio standard deviation
A two-asset portfolio’s risk from the weights, volatilities and correlation.
Files, large datasets and class scores
For data that are too long to type, or that come from a gradebook.
-
Standard deviation from CSV data
Paste rows from a CSV or spreadsheet export, pick the column and get its SD.
-
Standard deviation for large datasets
Thousands of values handled with Welford’s numerically stable method.
-
Test score standard deviation
The SD of a set of exam scores, with z-scores and how each student compares.
Using the standard deviation
What to do with an SD once you have it: standardise values, put an interval around it, express it as a percentage or draw it.
-
Z-score calculator
How many SDs one value sits from the mean, with its percentile and tail areas.
-
Z-scores with mean and SD
The mean, SD and a z-score for every value in the list.
-
Empirical rule calculator
The ranges holding 68%, 95% and 99.7% of values for a given mean and SD.
-
Confidence interval for standard deviation
A chi-square confidence interval for the population SD.
-
Relative standard deviation (%RSD)
The SD as a percentage of the mean (%RSD), as used for lab precision.
-
Coefficient of variation
The SD divided by the mean, to compare spread across different scales.
-
Standard deviation graph
A histogram of your data with the fitted normal curve and ±1, 2 and 3 SD bands shaded.
-
Bell curve generator
A normal curve drawn from any mean and SD, with the sigma bands shaded and labelled.
Which standard deviation do you need?
All the calculators here compute the same quantity: the square root of the average squared distance from the mean. They differ in two ways, the divisor and the shape of the input.
The divisor is n for a population SD and n − 1 for a sample SD. Dividing by n − 1 corrects for the fact that a sample’s own mean sits closer to its values than the true population mean does. If your numbers are a sample and you want to describe the wider group, which covers most lab, survey and classroom work, use the sample SD.
The input shape decides the page. A plain list goes into the main calculator. Values with counts go into the frequency table version, and class intervals such as 20–29 go into the grouped data version, which uses each class midpoint and so gives an estimate rather than an exact figure.
Worked comparison
For the values 2, 4, 4, 4, 5, 5, 7, 9 the mean is 5 and the squared deviations add to 32.
- Population variance: 32 ÷ 8 = 4, so σ = 2.
- Sample variance: 32 ÷ 7 ≈ 4.571, so s ≈ 2.138.
- Standard error of the mean: 2.138 ÷ √8 ≈ 0.756.
- Coefficient of variation: 2.138 ÷ 5 ≈ 42.8%.
With eight values the two SDs differ by about 7%. With 100 values the gap shrinks to about 0.5%, which is why the choice matters most for small samples.
Common mix-ups
- SD vs variance. Variance is in squared units (cm², £²), so it is hard to read directly. Report the SD; use the variance inside formulas such as ANOVA or pooling.
- SD vs standard error. Error bars labelled SE look much tighter than SD bars from the same data. The SD and SE calculator gives both so you can label them correctly.
- Averaging SDs. The combined SD of two groups is not the mean of their SDs. Pool the variances, weighted by degrees of freedom, with the pooled SD calculator.
Guides to read alongside
-
Standard deviation examples
Ten real-world problems worked in full, from exam scores to stock returns.