Statistics
Z-score standard deviation calculator
A z-score needs a mean and a standard deviation. When you only have the raw data, this calculator finds both first, then standardises every value. Open the working below the result for the full z-score table.
Separate numbers with commas, spaces or new lines, or paste a spreadsheet column.
Decimals and negatives are fine; write 10:3 for a value that occurs 3 times.
Your results will appear here: the standard deviation first, then the rest of the summary and a chart.
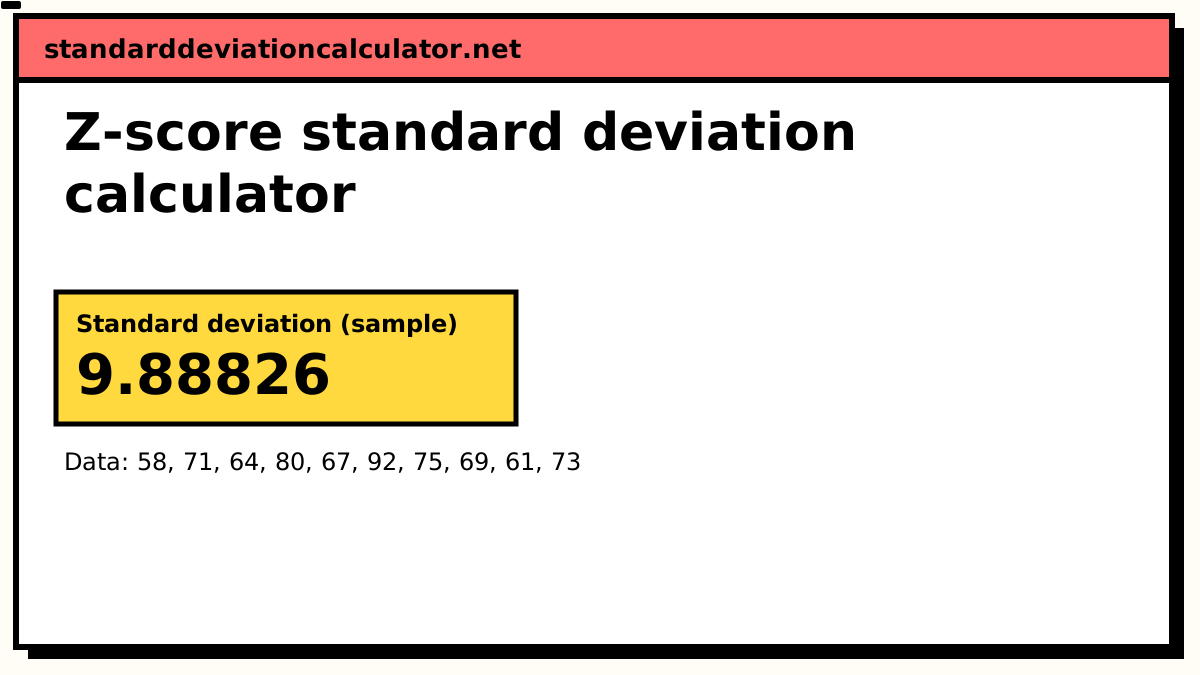
Standard deviation (sample)
9.88826
9.89
Your values typically sit about 9.89 above or below their mean of 71, in the same units as your data. 7 of 10 values (70%) fall between 61.11 and 80.89, within one standard deviation of the mean; for normally distributed data about 68% would.
Population SD (σ): 9.38083, if these values are the whole group.
- Count (n)
- 10
- Mean (x̄)
- 71
- Variance (s²)
- 97.7778
- Standard error
- 3.12694
- Minimum
- 58
- Q1 (25%)
- 64.75
- Median
- 70
- Q3 (75%)
- 74.5
- Maximum
- 92
- Range
- 34
More statistics (5)
- Relative SD (%RSD)
- 13.9271%
- Coefficient of variation
- 0.139271
- Sum (Σx)
- 710
- Sum of squares, Σ(x − x̄)²
- 880
- IQR (Q3 − Q1)
- 9.75
Data distribution
Shaded bands mark ±1, ±2 and ±3 SD from the mean. 7 of 10 values (70%) fall within ±1 SD.
Chart as text
Mean 71, sample standard deviation s = 9.88826, from 10 values between 58 and 92.
- Within ±1 SD (61.11 to 80.89): 7 of 10 values (70%). About 68% for normal data.
- Within ±2 SD: 9 (90%). About 95% for normal data.
- Within ±3 SD: 10 (100%). About 99.7% for normal data.
Show the working, step by step
From raw data to z-scores
1. x̄ = Σx ÷ n 2. s = √( Σ(x − x̄)² ÷ (n − 1) ) 3. z = (x − x̄) ÷ s for every value
A z-score is a deviation measured in standard deviations. z = 1.5 means one and a half SDs above the mean; z = −0.4 means four tenths of an SD below it. The units cancel, so z-scores from different scales can be compared.
A worked example: ten exam scores
Scores out of 100: 58, 71, 64, 80, 67, 92, 75, 69, 61, 73.
- Mean: 710 ÷ 10 = 71.
- Squared deviations sum to 880, so s² = 880 ÷ 9 = 97.7778 and s = 9.88826.
- Standardise each score:
| Score | x − x̄ | z |
|---|---|---|
| 58 | −13 | −1.315 |
| 61 | −10 | −1.011 |
| 64 | −7 | −0.708 |
| 67 | −4 | −0.405 |
| 69 | −2 | −0.202 |
| 71 | 0 | 0 |
| 73 | 2 | 0.202 |
| 75 | 4 | 0.405 |
| 80 | 9 | 0.910 |
| 92 | 21 | 2.124 |
The 92 is 2.12 standard deviations above the mean: well clear of the pack, but inside the ±3 cut-off, so the z-score screen does not flag it. Tukey's fences do: Q3 is 74.5 and the IQR 8.25, so the upper fence is 86.875 and 92 lies beyond it. The two methods disagree because the 92 itself inflates the SD it is being measured against — the classic weakness of z-scores on small samples.
Using the z-scores
- Comparing across scales. Standardise two tests, two instruments or two years and compare positions rather than raw values.
- Screening for outliers. |z| > 3 is the usual flag. The outlier calculator runs it beside quartile fences, the modified z-score and Grubbs' test and lists every flagged value; the IQR calculator shows the same fences on a box plot.
- Percentiles. For roughly normal data, z converts to a percentile: z = 2.12 is about the 98th. The z-score calculator does that conversion for a single value when you already know the mean and SD.
If you need only the spread and not the per-value table, the standard deviation calculator gives the same mean and SD with a dot plot.
Related calculators
-
Z-score calculator
One value, a mean and an SD, with the percentile.
-
Outlier & IQR calculator
Tukey fences, z-scores and Grubbs’ test together.
-
Standard deviation calculator
The general calculator, with both modes and a dot plot.
-
Percentile calculator
Rank each value without assuming a normal shape.
Common questions
Should z-scores use the sample or population standard deviation?
Use whichever standard deviation matches how you treat the data. Standardising scores within one class you are describing, the population SD is natural; standardising a sample to compare it with a wider group, the sample SD is the usual choice. The difference is small for large n. The z column in the working follows the mode you select.
What do the z-scores of a whole data set add up to?
Zero. Because the deviations from the mean sum to zero, so do the deviations divided by the SD. With the population SD the squared z-scores also average exactly 1; with the sample SD they sum to n − 1.
Can I compare z-scores from two different tests?
That is their main use. A 71 on a test with mean 71 (z = 0) and a 61 on a harder test with mean 52 and SD 6 (z = 1.5) are not comparable as raw marks, but the z-scores say the second was the stronger performance relative to the group. The comparison assumes the two groups are similar.
What z-score counts as unusual?
For roughly normal data, |z| > 2 happens about 5% of the time and |z| > 3 about 0.3%. The calculator flags values beyond 3. For small or skewed data sets, quartile-based fences are more reliable, because an extreme value inflates the SD it is measured against.