Root mean square vs standard deviation: what's the difference?
The two look like the same formula with one term moved. The root mean square (RMS) is the square root of the average of the squares of the values; the standard deviation is the square root of the average of the squares of the deviations from the mean. Everything about which number is the right one follows from that one difference: RMS measures distance from zero, the SD measures distance from the data's own centre.
The two formulas, side by side
RMS = √(Σx² / n) SD (population) = √(Σ(x − x̄)² / n)
Both square, both average, both take the root. The only thing that differs is what gets squared: the values themselves, or the values with their mean removed. In physical terms, the RMS of a set of measurements says how big the numbers are; the SD says how far apart they are. A city where every house sits 400 metres above sea level and the heights barely vary has a large "mean height" and a small SD. A signal that swings from +10 to −10 with a mean of zero has a large RMS and says nothing about the spread about its own centre.
The identity that connects them
RMS² = x̄² + σ²
The mean of the squares splits exactly into the square of the mean plus the variance, with nothing left over. Because σ² is never negative, the RMS is always at least the absolute value of the mean, and the gap between the two is the spread.
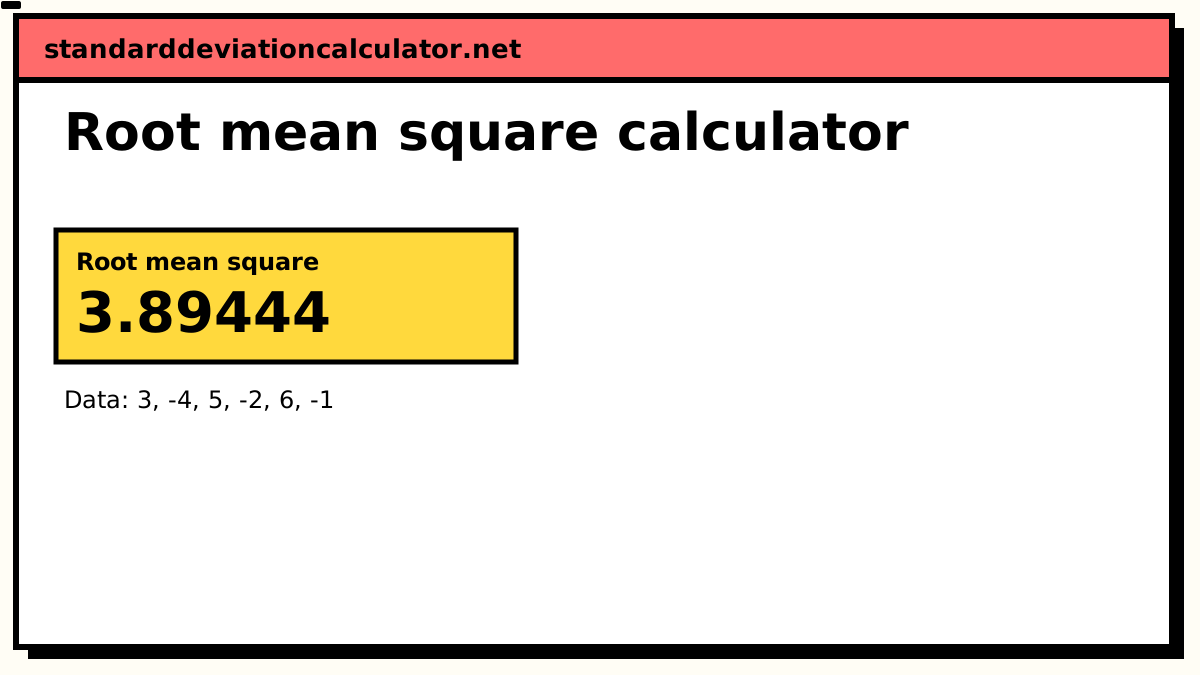
On the six values 3, −4, 5, −2, 6, −1 (the example the
RMS calculator loads): the mean is 7 ÷ 6 =
1.1667, the mean of the squares is 91 ÷ 6 = 15.1667, so the RMS is √15.1667 =
3.8944. The deviations from the mean have a mean of squares of
13.8056, so the population SD is √13.8056 = 3.7156. Check the identity:
1.1667² + 3.7156² = 1.3611 + 13.8056 = 15.1667, the mean of squares. The two quantities
are nearly equal here because the mean is small next to the spread; it is the spread, not
the level, that dominates.
When they become the same number
When the mean is exactly zero there is nothing to subtract, the (x − x̄) column is just the x column, and the RMS is the population standard deviation. Three situations where that happens:
- AC waveforms. A sine wave spends half its cycle negative, so its mean over a complete cycle is zero. The "RMS value" of the waveform is its SD. That is why engineers who say "RMS voltage" and people who say "standard deviation of the voltage" are often naming the same quantity.
- Regression residuals. A least-squares fitted line is positioned so the residuals sum to zero, so their mean is zero. The root mean square error is the standard deviation of the misses, about the fitted value.
- Noise about a baseline. A detector's background fluctuations are usually quoted as an RMS figure, which is the SD once you have subtracted the baseline.
Which one do you actually want?
Ask which question the number must answer. How big is this quantity, ignoring direction? — RMS: mains voltage, signal amplitude, vibration severity, the typical size of an error in a batch of measurements. How much do these values scatter about their own centre? — standard deviation: scores around a mean, daily returns around their average, replicate readings around their mean. If the level matters (the data has a large mean relative to the spread), the RMS and the SD will differ a lot, and reporting the wrong one reports the level instead of the spread.
A concrete pair from the same data: a factory runs at about 98 units with a scatter of about 2. The SD says 2; the RMS says about 98.01, which answers a completely different question. The standard deviation calculator and the RMS calculator show both on the same numbers.
Why the mix-up happens
Both are written with the same three symbols — square root, sigma, division by n — and both sit in the family of "mean square" quantities: the variance is the mean of squared deviations, the RMS is the mean of squared values, and the two differ by exactly the variance of the data. Textbooks that move between physics and statistics sometimes write σ for the RMS of a signal, which is why a "σ of the current" in an electrical paper is not the same concept as a "σ of the current" in a statistics paper. Read the definition line before comparing numbers from two sources; the formula shape alone does not tell you which centre was subtracted.
Related calculators
-
Root mean square calculator
RMS, sum of squares and the SD of the same data, worked in one pass.
-
Variance calculator
The σ² in the identity RMS² = x̄² + σ².
-
The SD formula explained
Every term in √(Σ(x − x̄)²/n).
-
MSE calculator
RMS of the residuals: RMSE and MAE together.
Common questions
What is the difference between RMS and standard deviation?
The root mean square squares the values themselves; the standard deviation squares the
values after subtracting the mean. Same formula shape, different origin:
RMS = √(Σx²/n) measures distance from zero,
SD = √(Σ(x − x̄)²/n) measures distance from the data's own centre. They are
tied together by RMS² = x̄² + σ².
When are RMS and standard deviation equal?
Exactly when the mean is zero. Then there is nothing to subtract before squaring, so the RMS of the values is the same number as the population standard deviation. That is the situation for a symmetrical AC waveform, regression residuals (mean zero by construction) and noise measured about its baseline.
Is the RMS a kind of average?
Yes: it is the quadratic mean, one of the means in the same family as the arithmetic, geometric and harmonic means. For any data it is at least as large as the absolute value of the arithmetic mean, and equal only when every value is identical.
Which should I use for AC voltage, and which for measurement noise?
Both use the root mean square. Mains voltage is quoted as an RMS figure because power depends on V². For noise or a signal about a zero baseline, the RMS of the measurements is their standard deviation, since the baseline is the mean.