Index number calculators
Every method for turning a basket of prices into one index number, from the unweighted simple aggregative index to Fisher’s ideal index. Each calculator shows the p₀q₀-style table behind the answer, which makes them useful for economics and business statistics coursework as well as for tracking real costs.
Which calculator do I need?
| You have or want | Use |
|---|---|
| Price change weighted by what was bought in the base year | Laspeyres price index |
| Price change weighted by what is bought now | Paasche price index |
| One index that passes the time and factor reversal tests | Fisher's ideal index |
| Every weighted method side by side on the same data | Weighted aggregative index |
| Prices only, no quantities | Simple aggregative method |
| The price relative of each item, or chain and link relatives for a series | Price relatives calculator |
Weighted aggregative indices
Price indices that weight each item by a quantity: base-year, current-year, both, or a fixed basket.
-
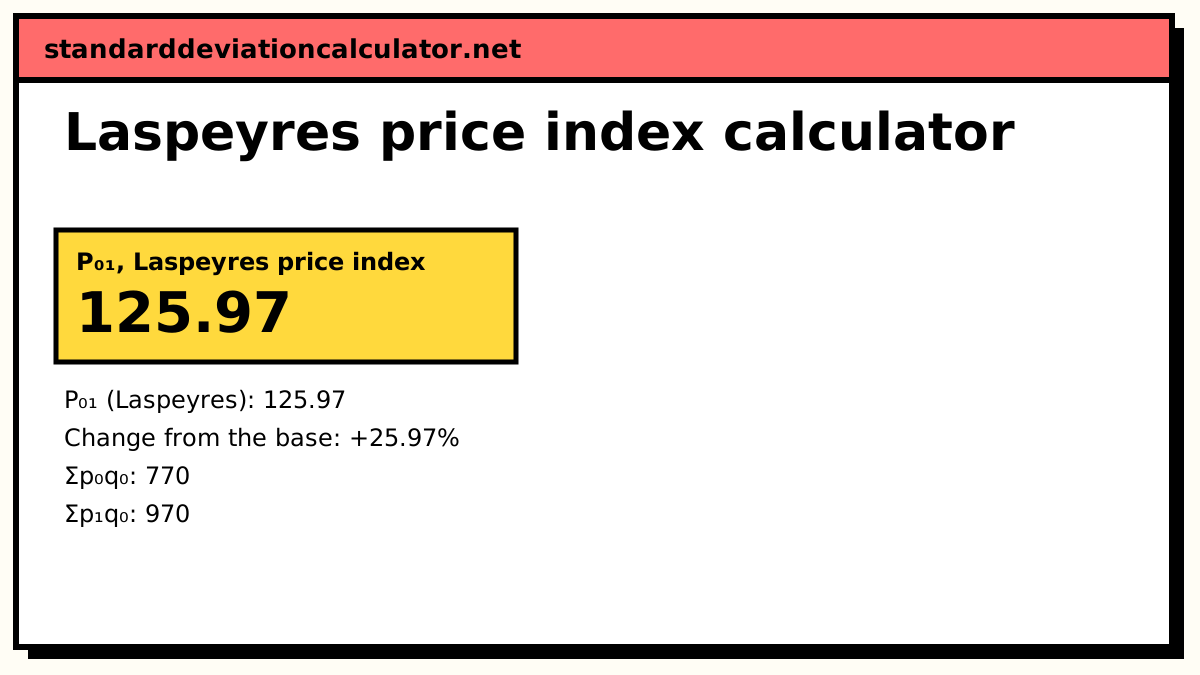
Laspeyres price index calculator
Σp₁q₀ / Σp₀q₀ × 100: prices weighted by base-year quantities, with the full p₀q₀ and p₁q₀ table.
-
Paasche price index calculator
Σp₁q₁ / Σp₀q₁ × 100: prices weighted by current-year quantities, with the working.
-
Fisher’s ideal index calculator
√(Laspeyres × Paasche), with the time reversal and factor reversal tests checked on your numbers.
-
Marshall–Edgeworth price index calculator
Σp₁(q₀ + q₁) / Σp₀(q₀ + q₁) × 100: the two years’ quantities added together as weights.
-
Dorbish–Bowley price index calculator
The arithmetic mean of the Laspeyres and Paasche indices, (L + P) / 2, with both shown.
-
Kelly’s price index calculator
Σp₁q / Σp₀q × 100 with a fixed basket q that does not change between the two periods.
-
Weighted aggregative index calculator
Σp₁w / Σp₀w by six methods, from Laspeyres to Fisher, compared side by side on the same data.
Simple indices and price relatives
Unweighted indices, and methods that start from each item’s own price ratio.
-
Simple aggregative method calculator
Σp₁ / Σp₀ × 100, the unweighted index, with a quantity index option (Σq₁ / Σq₀).
-
Price relatives calculator
p₁/p₀ × 100 for each item, plus fixed-base, link and chain relatives for a price series.
-
Simple average of price relatives calculator
ΣR / N or antilog(Σ log R / N): an unweighted index from each item’s price relative.
-
Weighted average of price relatives calculator
ΣRW / ΣW with value weights W = p₀q₀ or your own weights, arithmetic or geometric.
How the methods differ
All the weighted methods compare the cost of a basket at current prices (p₁) with its cost at base prices (p₀). They differ only in which quantities fill the basket. Laspeyres uses base-year quantities q₀, so it needs no new quantity data each period, which is why most consumer price indices are built this way. Paasche uses current quantities q₁. Marshall–Edgeworth adds the two sets of quantities together, Dorbish–Bowley takes the arithmetic mean of Laspeyres and Paasche, and Fisher takes their geometric mean. Kelly's index uses a fixed basket that belongs to neither year.
A worked comparison
Two goods. A: price 10 → 15, quantity 5 → 3. B: price 4 → 5, quantity 10 → 14. Buyers have moved away from A, whose price rose 50%, towards B, which rose 25%.
| Method | Calculation | Index |
|---|---|---|
| Simple aggregative | 20 / 14 × 100 | 142.86 |
| Simple average of relatives | (150 + 125) / 2 | 137.50 |
| Laspeyres | 125 / 90 × 100 | 138.89 |
| Paasche | 115 / 86 × 100 | 133.72 |
| Fisher | √(138.89 × 133.72) | 136.28 |
| Dorbish–Bowley | (138.89 + 133.72) / 2 | 136.30 |
| Marshall–Edgeworth | 240 / 176 × 100 | 136.36 |
Laspeyres comes out highest of the weighted indices because it still weights A at its old quantity, ignoring the switch to the cheaper good. Paasche comes out lowest. That gap is substitution bias, and the compromise indices land between the two. The simple aggregative index is highest of all because A's larger price dominates the unweighted total.
Common mix-ups
- Price relatives versus aggregates. A price relative is one item's p₁ / p₀ × 100. Averaging relatives treats a 10% rise the same for every item; aggregating prices lets expensive items dominate.
- Weighting relatives by value. The weighted average of price relatives with weights p₀q₀ gives exactly the Laspeyres index, a useful check on your working.
- Base year equals 100. Every index here is 100 in the base period; 136 means prices are 36% higher, not 136% higher.
Guides to read alongside
Common questions
Why is Fisher’s index called “ideal”?
It passes both the time reversal test (the index from year 1 back to year 0 is the reciprocal of the forward index) and the factor reversal test (price index × quantity index equals the change in total value). Laspeyres and Paasche each fail both.
Which index does a consumer price index use?
Most official CPIs are Laspeyres-type: they price a basket fixed at an earlier reference period and update the basket every year or few years. Some statistical agencies also publish a chained or superlative index, such as Fisher or Törnqvist, to reduce substitution bias.
Can I build a quantity index with these calculators?
Yes. Swap the roles of prices and quantities: a Laspeyres quantity index is Σq₁p₀ / Σq₀p₀ × 100. The simple aggregative calculator has a quantity index option built in.