Statistics
Paasche price index calculator
The Paasche index weights prices by what is bought now. Enter each commodity's base and current prices (p₀, p₁) and its current quantity q₁; the base quantity q₀ is used for the quantity index and the time reversal check.
Add a row for each commodity. Prices must be above zero; quantities and weights cannot be negative.
| Commodity | p₀ | q₀ | p₁ | q₁ | p₀q₁ | p₁q₁ |
|---|---|---|---|---|---|---|
| A | 10 | 20 | 15 | 15 | 150 | 225 |
| B | 8 | 15 | 10 | 14 | 112 | 140 |
| C | 5 | 30 | 6 | 36 | 180 | 216 |
| D | 20 | 10 | 24 | 9 | 180 | 216 |
| E | 4 | 25 | 4 | 32 | 128 | 128 |
| Σ | 750 | 925 |
Show the working, step by step
Multiply across each row to get p₀q₁, p₁q₁, then add each column.
Σp₀q₁ = 750 Σp₁q₁ = 925
Divide and multiply by 100.
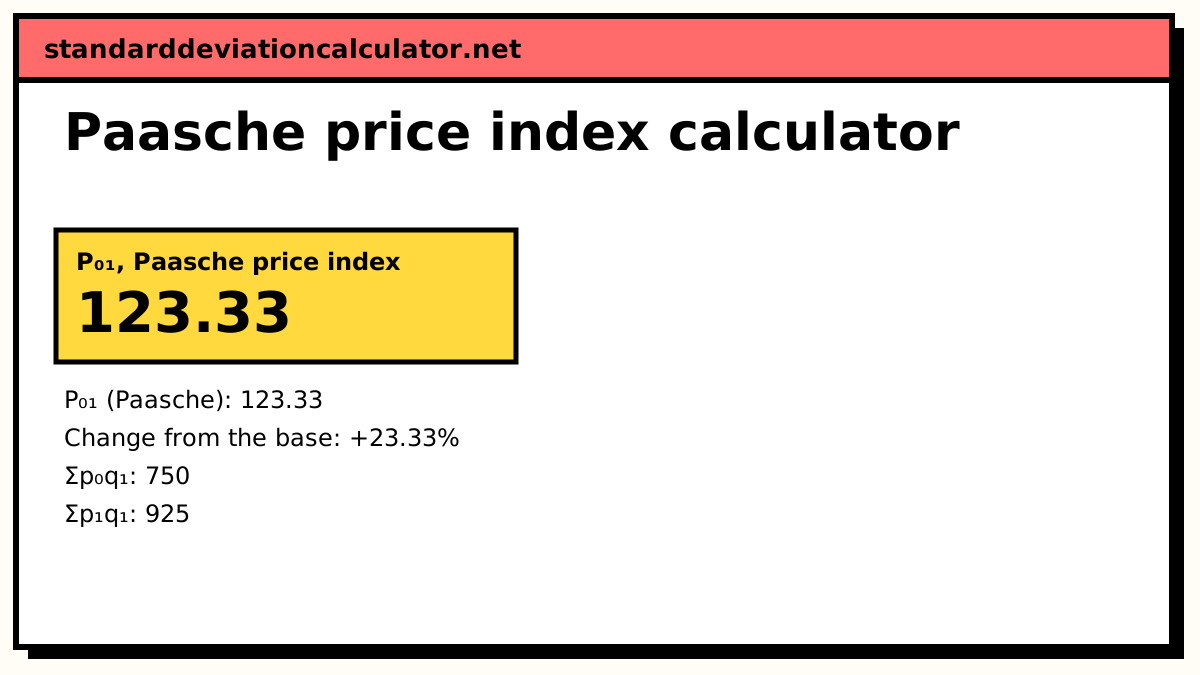
P₀₁ (Paasche) = Σp₁q₁ / Σp₀q₁ × 100 = 925 / 750 × 100 = 123.33
P₀₁ = 123.33 means prices in the current period are 23.33% higher than in the base period. Time reversal test: P₁₀ = 79.38, and P₀₁ × P₁₀ = 123.33/100 × 79.38/100 = 0.9790, which is not 1, so the test is not met.
The formula
P₀₁ (Paasche) = Σp₁q₁ / Σp₀q₁ × 100
Hermann Paasche (1874) turned Laspeyres' question round. Instead of asking what the old basket costs now, it asks how much more the current basket costs than it would have done at base-year prices. The numerator Σp₁q₁ is actual current spending, which is often easier to measure than a hypothetical; the denominator Σp₀q₁ re-prices those same quantities at the old prices.
A worked example
The calculator's default data, using the current quantities q₁:
| Commodity | p₀ | p₁ | q₁ | p₀q₁ | p₁q₁ |
|---|---|---|---|---|---|
| A | 10 | 15 | 15 | 150 | 225 |
| B | 8 | 10 | 14 | 112 | 140 |
| C | 5 | 6 | 36 | 180 | 216 |
| D | 20 | 24 | 9 | 180 | 216 |
| E | 4 | 4 | 32 | 128 | 128 |
| Σ | 750 | 925 |
- Σp₀q₁ = 150 + 112 + 180 + 180 + 128 = 750.
- Σp₁q₁ = 225 + 140 + 216 + 216 + 128 = 925.
- P₀₁ = 925 / 750 × 100 = 123.33, a price rise of 23.33%.
On the same data the Laspeyres index is 125.97. The gap of 2.64 points comes entirely from the change in the basket: A (up 50%) is bought less and E (unchanged) is bought more.
Does Paasche over- or under-state inflation?
Paasche tends to understate the rise in the cost of living. Its basket is the one people chose after prices changed, already tilted towards whatever became relatively cheap. Pricing that basket in the base year makes the base look dearer than it felt at the time, which pulls the index down. The bias is the mirror image of Laspeyres' upward substitution bias, so the two indices bracket the true change. Averaging them, geometrically in Fisher's index (124.65) or arithmetically in the Dorbish–Bowley index, cancels most of both biases.
The ordering can reverse. If quantities rise for the items whose prices rose most (a fashion, or a rise in income that shifts spending to dearer goods), Paasche comes out above Laspeyres. Compare the two on your own data with the calculator.
Laspeyres and Paasche compared
| Laspeyres | Paasche | |
|---|---|---|
| Weights | Base-year quantities q₀ | Current-year quantities q₁ |
| Formula | Σp₁q₀ / Σp₀q₀ × 100 | Σp₁q₁ / Σp₀q₁ × 100 |
| Usual bias | Upward | Downward |
| Data needed each period | Prices only | Prices and quantities |
| Default example | 125.97 | 123.33 |
Common mistakes
- Dividing by Σp₀q₀ instead of Σp₀q₁. That is the value index V₀₁ = 925 / 770 × 100 = 120.13, which mixes the price change with the change in quantities.
- Comparing two Paasche figures from different years as if they measured the same basket. Each compares the current year only with the base.
Common questions
What is the formula for the Paasche price index?
P₀₁ = Σp₁q₁ / Σp₀q₁ × 100. The weights are the current-year quantities
q₁. Σp₁q₁ is what was actually spent in the current year, and Σp₀q₁ is what the same
current basket would have cost at base-year prices. For the default data, 925 / 750 × 100
= 123.33.
Does the Paasche index overstate or understate inflation?
It usually understates it. The current basket already contains more of the items that became relatively cheap and less of those that became dear, so valuing that basket in both years gives the price rises less weight than a buyer in the base year would have felt. Laspeyres errs the other way, which is why Paasche is typically the lower of the two: 123.33 against 125.97 in the example.
What is the difference between the Laspeyres and Paasche indices?
Only the weights. Laspeyres uses base-year quantities (q₀), Paasche uses current-year quantities (q₁). Laspeyres answers “what does the old basket cost now?”, Paasche answers “what would today's basket have cost then?”. When prices and quantities move in opposite directions, as they do when people substitute, Laspeyres ≥ Paasche.
Why is the Paasche index used less often than Laspeyres?
It needs fresh quantity data for every period, which means a new expenditure survey each time, and because the weights change every year, a Paasche index for 2024 and one for 2025 are not strictly comparable with each other. Laspeyres fixes the weights, so only prices have to be collected.
What is the Paasche quantity index?
Q₀₁ = Σq₁p₁ / Σq₀p₁ × 100: both years' quantities valued at current prices.
For the default table that is 925 / 970 × 100 = 95.36. Choose “Quantity index” in the
calculator to see the working.
Related calculators
-
Laspeyres price index
Base-year quantities as weights, Σp₁q₀ / Σp₀q₀ × 100.
-
Fisher’s ideal index
√(L × P): the geometric mean of Laspeyres and Paasche.
-
Dorbish–Bowley index
The arithmetic mean of Laspeyres and Paasche.
-
Weighted aggregative index
Every weighted formula side by side on one data set.