Statistics
Weighted average of price relatives calculator
Weight each commodity's price relative by what is spent on it. Enter base prices, base quantities and current prices for value weights (W = p₀q₀), or switch to entering your own weights.
Add a row for each commodity. Prices must be above zero; quantities and weights cannot be negative.
Add a row for each commodity. Prices must be above zero; quantities and weights cannot be negative.
Bar height is the price relative R; bar width is the weight W = p₀q₀. Wide bars pull the index (solid line) towards them; the dashed line is the base, 100.
| Commodity | p₀ | q₀ | p₁ | W = p₀q₀ | R = p₁/p₀ × 100 | RW |
|---|---|---|---|---|---|---|
| A | 10 | 20 | 15 | 200 | 150.00 | 30000 |
| B | 8 | 15 | 10 | 120 | 125.00 | 15000 |
| C | 5 | 30 | 6 | 150 | 120.00 | 18000 |
| D | 20 | 10 | 24 | 200 | 120.00 | 24000 |
| E | 4 | 25 | 4 | 100 | 100.00 | 10000 |
| Σ | 770 | 97000 |
Show the working, step by step
Weight each commodity by its base-year value W = p₀q₀ (what was spent on it in the base year).
A: 10 × 20 = 200 B: 8 × 15 = 120 C: 5 × 30 = 150 D: 20 × 10 = 200 E: 4 × 25 = 100 ΣW = 770
Work out each price relative R = p₁ / p₀ × 100.
A: 15 / 10 × 100 = 150.00 B: 10 / 8 × 100 = 125.00 C: 6 / 5 × 100 = 120.00 D: 24 / 20 × 100 = 120.00 E: 4 / 4 × 100 = 100.00
Multiply each relative by its weight and add.
ΣRW = 97000
Divide by ΣW.
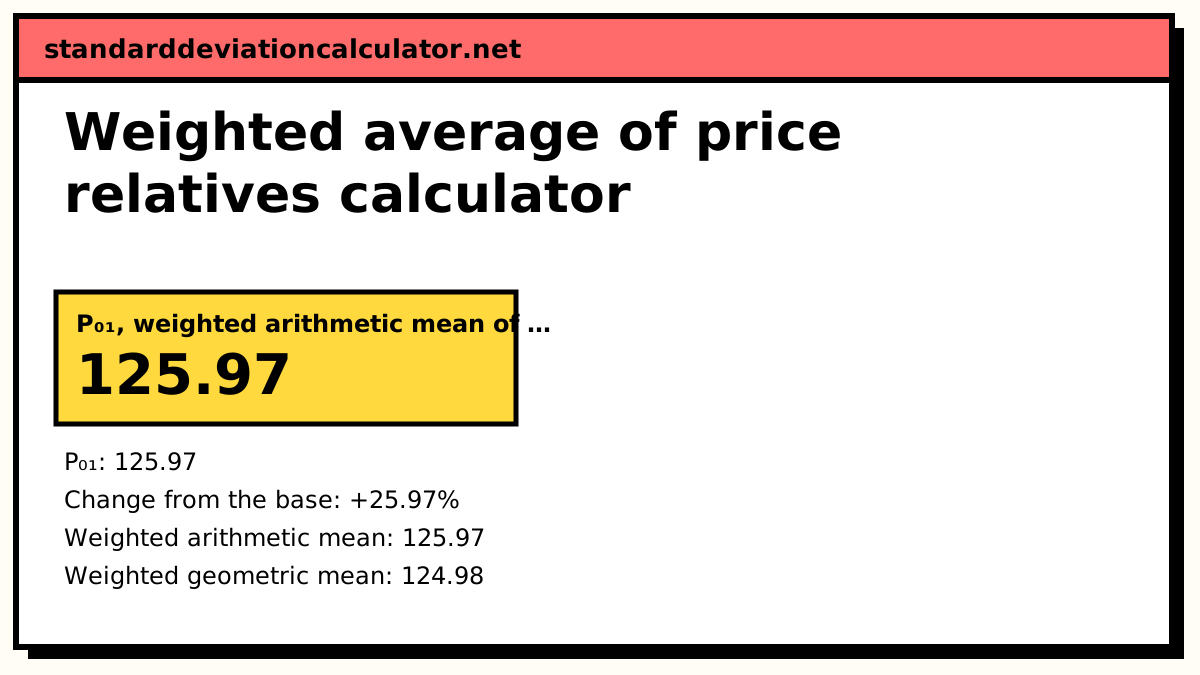
P₀₁ = ΣRW / ΣW = 97000 / 770 = 125.97
prices in the current period are 25.97% higher than in the base period. With W = p₀q₀ this is exactly the Laspeyres index, because RW = (p₁/p₀ × 100) × p₀q₀ = 100 p₁q₀: Laspeyres = 125.97.
The formulas
R = p₁ / p₀ × 100 W = p₀q₀ (or given weights) Arithmetic: P₀₁ = ΣRW / ΣW Geometric: P₀₁ = antilog( ΣW log R / ΣW )
The relative R measures each item's price change; the weight W says how much that change should matter. With W as base-year spending, a 50% rise in an item that took 26% of the budget moves the index far more than a 50% rise in one that took 1%.
A worked example
The calculator's default data, with value weights:
| Commodity | p₀ | q₀ | p₁ | W = p₀q₀ | R | RW |
|---|---|---|---|---|---|---|
| A | 10 | 20 | 15 | 200 | 150 | 30,000 |
| B | 8 | 15 | 10 | 120 | 125 | 15,000 |
| C | 5 | 30 | 6 | 150 | 120 | 18,000 |
| D | 20 | 10 | 24 | 200 | 120 | 24,000 |
| E | 4 | 25 | 4 | 100 | 100 | 10,000 |
| Σ | 770 | 97,000 |
- ΣW = 770 and ΣRW = 97,000.
- P₀₁ = 97,000 / 770 = 125.97.
- Weighted geometric mean: ΣW log R = 1,614.56, divided by 770 gives 2.096832, and antilog(2.096832) = 124.98.
The arithmetic answer equals the Laspeyres index (970 / 770 × 100), as it must with W = p₀q₀. The simple, unweighted mean of the same five relatives is 123.00: weighting raises the index here because A, the item with the biggest rise, also has one of the biggest budgets.
Does it over- or under-state inflation?
With base-year value weights and an arithmetic mean, this is a Laspeyres index, so it carries Laspeyres' upward substitution bias: the weights describe spending before prices changed, when buyers had not yet moved away from the items that became dear. The bias grows as the weights age, which is why consumer price indices update their weights every few years. The weighted geometric mean (124.98 here) partly allows for substitution and sits lower. With custom weights, the direction depends on where the weights came from: weights from a later period behave more like Paasche and tend to understate.
Weighted relatives or weighted aggregates?
The two routes give the same Laspeyres number, but relatives are more practical when you have budget shares rather than quantities, which is how most price statistics are compiled: survey the share of spending on each group, collect prices, compute relatives, and weight. Aggregates are more natural when you know actual quantities, as in most textbook exercises.
Common questions
What is the formula for the weighted average of price relatives?
P₀₁ = ΣRW / ΣW, where R = p₁ / p₀ × 100 is each commodity's price relative
and W its weight. With value weights W = p₀q₀, the default data gives
ΣRW = 97,000 and ΣW = 770, so P₀₁ = 125.97.
Why is the weight usually the base-year value p₀q₀?
A price relative is a percentage, so its weight should reflect how much money is at stake: what was spent on the item. Base-year value p₀q₀ is exactly that. Quantities alone would not do, because a kg of salt and a kg of saffron are not comparable, but money spent on each is.
Is the weighted average of price relatives the same as Laspeyres?
Yes, when W = p₀q₀ and the mean is arithmetic. RW = (p₁/p₀ × 100) × p₀q₀ = 100 p₁q₀, so ΣRW / ΣW = Σp₁q₀ / Σp₀q₀ × 100, the Laspeyres formula. That is why statistical offices can build a Laspeyres CPI from price relatives and household budget shares.
Can I use percentage weights instead of values?
Yes. Only the proportions matter, since the formula divides by ΣW. Budget shares such as 30, 15, 25, 20 and 10 (summing to 100) are typical. Choose “Enter my own weights” in the calculator. With those weights the default prices give ΣRW = 12,775 and P₀₁ = 127.75.
What is the weighted geometric mean of price relatives?
P₀₁ = antilog(ΣW log R / ΣW). It is never higher than the weighted
arithmetic mean: 124.98 against 125.97 with value weights on the default data. It is less
prone to upward bias and is used for some sub-indices of national CPIs.
Related calculators
-
Simple average of price relatives
The unweighted version, ΣR / N or the geometric mean.
-
Laspeyres price index
The same answer as ΣRW / ΣW with W = p₀q₀.
-
Price relatives
p₁/p₀ × 100 for each item, and link and chain relatives.
-
Weighted mean
Σwx / Σw for any values and weights.