Statistics
Simple average of price relatives calculator
Turn each commodity's price change into a relative (p₁/p₀ × 100) and average them. Enter base and current prices; choose the arithmetic or the geometric mean.
Add a row for each commodity. Prices must be above zero; quantities and weights cannot be negative.
Each bar is one commodity’s relative. The solid line is their arithmetic mean, the index; the dashed line is the base, 100.
| Commodity | p₀ | p₁ | R = p₁/p₀ × 100 | log R |
|---|---|---|---|---|
| A | 10 | 15 | 150.00 | 2.1761 |
| B | 8 | 10 | 125.00 | 2.0969 |
| C | 5 | 6 | 120.00 | 2.0792 |
| D | 20 | 24 | 120.00 | 2.0792 |
| E | 4 | 4 | 100.00 | 2.0000 |
| Σ | 615.00 | 10.4314 |
Show the working, step by step
Work out each price relative R = p₁ / p₀ × 100.
A: 15 / 10 × 100 = 150.00 B: 10 / 8 × 100 = 125.00 C: 6 / 5 × 100 = 120.00 D: 24 / 20 × 100 = 120.00 E: 4 / 4 × 100 = 100.00
Add the relatives.
ΣR = 150.00 + 125.00 + 120.00 + 120.00 + 100.00 = 615.00
Divide by the number of commodities, N = 5.
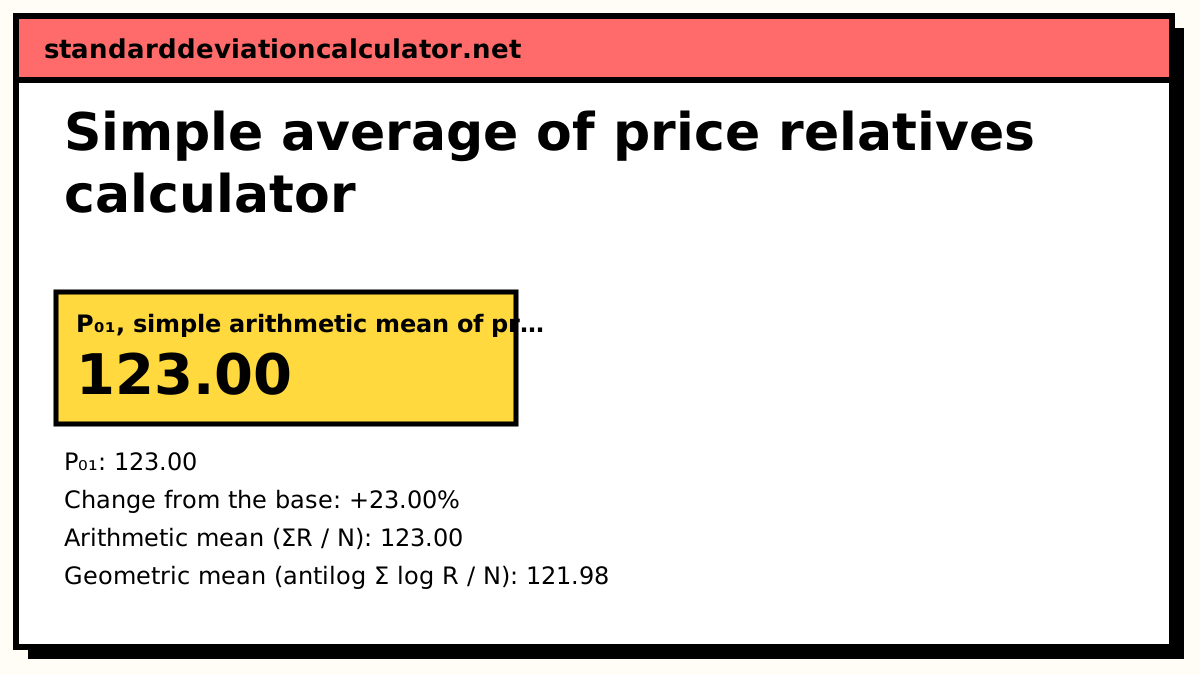
P₀₁ = ΣR / N = 615.00 / 5 = 123.00
prices in the current period are 23.00% higher than in the base period. Time reversal test: P₀₁ × P₁₀ = 1.0168, above 1, so the test is not met: the arithmetic mean of relatives is biased upwards. The geometric mean of the same relatives is 121.98.
The formulas
R = p₁ / p₀ × 100 Arithmetic mean: P₀₁ = ΣR / N Geometric mean: P₀₁ = antilog( Σ log R / N )
N is the number of commodities. Each relative is already a percentage of its own base price, so a commodity priced per kg and one priced per tonne are on the same footing, which fixes the units problem of the simple aggregative method.
A worked example
The calculator's default prices, with the relatives and their common logs:
| Commodity | p₀ | p₁ | R = p₁/p₀ × 100 | log R |
|---|---|---|---|---|
| A | 10 | 15 | 150 | 2.1761 |
| B | 8 | 10 | 125 | 2.0969 |
| C | 5 | 6 | 120 | 2.0792 |
| D | 20 | 24 | 120 | 2.0792 |
| E | 4 | 4 | 100 | 2.0000 |
| Σ | 615 | 10.4314 |
- Arithmetic mean: P₀₁ = 615 / 5 = 123.00 (the calculator's default).
- Geometric mean: Σ log R / N = 10.4314 / 5 = 2.0863, and antilog(2.0863) = 121.98.
The geometric mean is lower, as it always is unless every relative is the same. Both are below the simple aggregative figure of 125.53 for these prices, because the relatives method no longer lets the dearest item (D) carry extra weight.
Does it over- or under-state inflation?
The arithmetic mean of relatives has a built-in upward bias. Averages of ratios exaggerate change: reverse the years and the backward index, 82.67 here, does not undo the forward one, because 1.2300 × 0.8267 = 1.0168. The index fails the time reversal test in the direction of too much inflation. The geometric mean passes the test exactly and is lower. It also allows for some substitution between the items, since it corresponds to buyers keeping their spending shares constant when relative prices change. That is why the US CPI moved to geometric means within most item categories in 1999, and why national CPIs typically use geometric means of relatives at the lowest level of aggregation.
Either version ignores how much is spent on each item, so an unimportant commodity with a big price change can distort the result in either direction.
Common mistakes
- Averaging the prices instead of the relatives. The relatives must be computed first.
- Using natural logs and then the base-10 antilog (or the reverse). Either base works, as long as you undo the log with the same base; this calculator uses common logs as the textbooks do.
- Leaving out the × 100 on one item. Every R must be on the same scale.
Common questions
What is the simple average of price relatives method?
Work out each commodity's price relative R = p₁ / p₀ × 100, then average them:
P₀₁ = ΣR / N. For the default data the relatives are 150, 125, 120, 120 and 100,
so P₀₁ = 615 / 5 = 123.00. Because every relative is a percentage, the units prices are
quoted in no longer matter.
How do you use the geometric mean of price relatives?
Take the common log of each relative, average the logs and take the antilog:
P₀₁ = antilog(Σ log R / N). For the default data Σ log R = 10.4314, so
P₀₁ = antilog(10.4314 / 5) = antilog(2.0863) = 121.98. Choose “Geometric mean” in the
calculator.
Why is the geometric mean preferred for price relatives?
It treats rises and falls symmetrically. A price that doubles (R = 200) and one that halves (R = 50) average to 125 arithmetically but to 100 geometrically, which is the sensible answer. The geometric mean also satisfies the time reversal test, while the arithmetic mean does not.
Does the arithmetic mean of price relatives overstate inflation?
Yes. An arithmetic mean of ratios is biased upwards (this form is known as the Carli index). On the default data, averaging forward gives 123.00 and averaging backward gives 82.67; 1.2300 × 0.8267 = 1.0168, not 1, so each direction shows more change than the other undoes. The geometric mean of the same relatives is 121.98.
What is the drawback of a simple average of relatives?
Every commodity counts equally. A 50% rise in something households barely buy moves the index as much as a 50% rise in rent. When you know how much is spent on each item, use the weighted average of price relatives instead.
Related calculators
-
Weighted average of price relatives
ΣRW / ΣW, with value weights or your own.
-
Price relatives
p₁/p₀ × 100 for each item, with link and chain relatives.
-
Simple aggregative method
Σp₁ / Σp₀ × 100: add prices first, then divide.
-
Geometric mean
The nth root of a product, with the log working.