Statistics
Price relatives calculator
A price relative is one price as a percentage of another. Enter a price series year by year for fixed-base, link and chain relatives, or switch to a list of commodities for each one's p₁/p₀ × 100.
One row per year (or month), in time order. Prices must be above zero.
Must match a year in the table. Leave blank for the first row.
Add a row for each commodity. Prices must be above zero; quantities and weights cannot be negative.
| Year | Price | Fixed base (2020 = 100) | Link relative | Chain index | Change on year |
|---|---|---|---|---|---|
| 2020 | 40 | 100.00 | — | 100.00 | — |
| 2021 | 44 | 110.00 | 110.00 | 110.00 | +10.00% |
| 2022 | 50 | 125.00 | 113.64 | 125.00 | +13.64% |
| 2023 | 55 | 137.50 | 110.00 | 137.50 | +10.00% |
| 2024 | 60 | 150.00 | 109.09 | 150.00 | +9.09% |
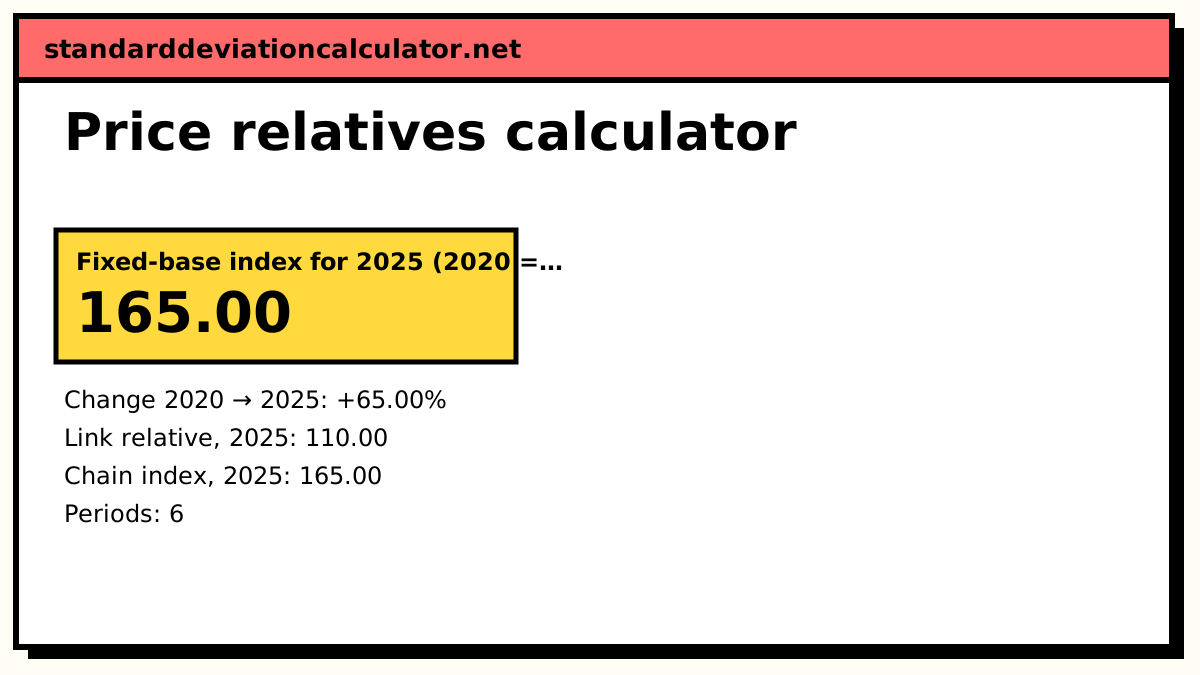
| 2025 | 66 | 165.00 | 110.00 | 165.00 | +10.00% |
Show the working, step by step
Fixed-base index: divide each price by the 2020 price (40) and multiply by 100.
2020: 40 / 40 × 100 = 100.00 2021: 44 / 40 × 100 = 110.00 2022: 50 / 40 × 100 = 125.00 2023: 55 / 40 × 100 = 137.50 2024: 60 / 40 × 100 = 150.00 2025: 66 / 40 × 100 = 165.00
Link relative: divide each price by the previous year’s price and multiply by 100.
2021: 44 / 40 × 100 = 110.00 2022: 50 / 44 × 100 = 113.64 2023: 55 / 50 × 100 = 110.00 2024: 60 / 55 × 100 = 109.09 2025: 66 / 60 × 100 = 110.00
Chain index: start at 100 in 2020, then multiply each link relative by the previous chain index and divide by 100.
2021: 110.00 × 100.00 / 100 = 110.00 2022: 113.64 × 110.00 / 100 = 125.00 2023: 110.00 × 125.00 / 100 = 137.50 2024: 109.09 × 137.50 / 100 = 150.00 2025: 110.00 × 150.00 / 100 = 165.00
For a single price series the chain index equals the fixed-base index with the first year as base: chaining the link relatives just rebuilds each price over the first price. The two differ for multi-item indices, where the weights are updated at every link.
The formulas
Price relative: R = p₁ / p₀ × 100 Fixed-base relative: Iₜ = Pₜ / P_base × 100 Link relative: LRₜ = Pₜ / Pₜ₋₁ × 100 Chain-base index: CIₜ = LRₜ × CIₜ₋₁ / 100, CI₁ = 100
Every index number is built from relatives. A relative describes one commodity; the other index calculators on this site combine many relatives into a single figure, by averaging them or by weighting them with quantities.
A worked example
The calculator's default series: one item's price from 2020 to 2025, with 2020 as base.
| Year | Price | Fixed base (2020 = 100) | Link relative | Chain index |
|---|---|---|---|---|
| 2020 | 40 | 100.00 | — | 100.00 |
| 2021 | 44 | 110.00 | 110.00 | 110.00 |
| 2022 | 50 | 125.00 | 113.64 | 125.00 |
| 2023 | 55 | 137.50 | 110.00 | 137.50 |
| 2024 | 60 | 150.00 | 109.09 | 150.00 |
| 2025 | 66 | 165.00 | 110.00 | 165.00 |
- Fixed base: 66 / 40 × 100 = 165.00 for 2025, a 65% rise since 2020.
- Link relative for 2022: 50 / 44 × 100 = 113.64, so the price rose 13.64% in that one year.
- Chain index for 2022: 113.64 × 110 / 100 = 125.00, the same as the fixed-base figure.
For the commodity list option, the default prices give relatives of 150 (A), 125 (B), 120 (C), 120 (D) and 100 (E): A rose by half, E did not change.
Fixed base or chain base: which over- or under-states inflation?
For one price the question does not arise: the chain and fixed-base numbers are identical, as the table shows. It matters for a weighted index of many items. A fixed-base Laspeyres index keeps base-year weights for years, so it steadily overweights goods that have become relatively dear and overstates inflation more the further it gets from the base. A chain index re-weights at every link, so its substitution bias stays small; this is why many statistical offices now chain their indices annually, and why the US publishes a chained CPI (C-CPI-U) that typically runs below the ordinary CPI. The risk in the other direction is chain drift: with prices that swing up and down, chained link relatives can compound small errors, and chained arithmetic averages of relatives drift upwards.
Common mistakes
- Dividing by the wrong year. A fixed-base relative always divides by the base-year price; a link relative always divides by the previous year's price.
- Adding link relatives instead of multiplying them. Five link relatives of 110 chain to 100 × 1.1⁵ = 161.05 on the chain, not 150.
- Reading a relative of 113.64 as a 113.64% rise. It is a 13.64% rise; subtract 100.
Common questions
What is a price relative?
The current price of one commodity as a percentage of its base price:
R = p₁ / p₀ × 100. A price that goes from 10 to 15 has a relative of 150,
meaning a 50% rise. A relative below 100 means the price fell.
What is a link relative?
Each period's price as a percentage of the previous period's price:
LR = Pₜ / Pₜ₋₁ × 100. For prices of 40, 44 and 50 in 2020, 2021 and 2022, the
link relatives are 110 (2021) and 113.64 (2022). The first period has no link relative.
How do you calculate a chain base index?
Start at 100 in the first period, then multiply each link relative by the previous chain
index and divide by 100: CIₜ = LRₜ × CIₜ₋₁ / 100. With link relatives of 110 and
113.64, the chain index is 100, 110 and 110 × 113.64 / 100 = 125.
What is the difference between fixed base and chain base?
A fixed-base index compares every period with one chosen base period. A chain-base index compares each period with the one before and links the comparisons together. For a single price series the two give the same numbers (when the base is the first period). For an index of many items they differ, because a chain index can update its weights at every link.
What are the advantages of the chain base method?
Items can be added or dropped at any link, and the weights stay close to current buying patterns, so the index suffers less from substitution bias than a fixed-base Laspeyres index whose weights grow old. The drawback is that errors in one link carry into every later value, and a chained index can drift if prices bounce up and down.
How do I shift the base year of an index?
Divide every index value by the value in the new base year and multiply by 100. With the default series on a 2020 base, 2022 is 125. Rebasing to 2022 turns 2025's 165 into 165 / 125 × 100 = 132. Type 2022 as the base year in the calculator to see the whole column.
Related calculators
-
Simple average of price relatives
Combine several relatives into one index.
-
Weighted average of price relatives
Relatives weighted by spending, ΣRW / ΣW.
-
Laspeyres price index
A weighted index from prices and base quantities.
-
Inflation calculator
What an amount of money is worth after years of price rises.