Applied math calculators
Formula calculators for physics, engineering, chemistry, finance, economics and applied statistics. Each gathers the standard equations of one field on a single page, so you can solve for whichever quantity is missing.
Which calculator do I need?
| You have or want | Use |
|---|---|
| Distance, speed or time from a constant acceleration, or projectile range | Physics calculator |
| Current from voltage and resistance, or a voltage divider | Engineering calculator |
| Molar mass, molarity, a dilution or pH | Chemistry calculator |
| The present or future value of money, or the NPV and IRR of cash flows | Financial mathematics calculator |
| Price elasticity of demand, CAGR or the GDP deflator | Econometrics calculator |
| A frequency table and histogram from raw data | Data analysis calculator |
| Sensitivity, odds ratio or relative risk from a 2×2 table | Biostatistics calculator |
Physical sciences and engineering
The standard formulas of mechanics, circuits and chemistry, solved for any unknown.
-
Physics calculator
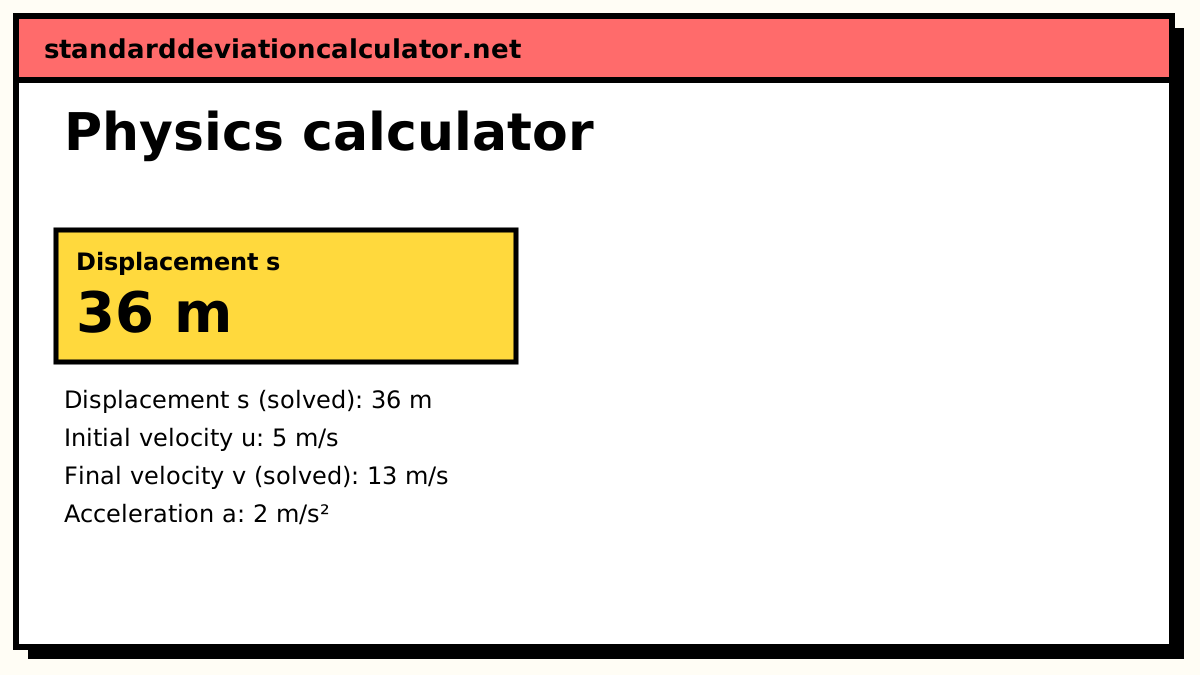
SUVAT from any three values, F = ma, energy, power, momentum, projectile range and height, density, pressure and wave speed.
-
Engineering calculator
Ohm's law, resistor and capacitor networks, voltage dividers, stress and strain, torque, gear ratios and RC time constants.
-
Chemistry calculator
Molar mass from a formula, moles and particles, molarity, dilution, the ideal gas law, pH and percent composition.
Finance and economics
The time value of money and the ratios economists use.
-
Financial mathematics calculator
Present and future values, annuities and perpetuities, effective rates, and the NPV, IRR and payback of cash flows.
-
Econometrics calculator
Price, income and cross elasticity, the GDP deflator, CAGR, the Durbin–Watson statistic and simple OLS with standard errors.
Data and health statistics
Applied statistics for summarising data and reading clinical 2×2 tables.
-
Data analysis calculator
Raw data to a frequency table: classes by width or Sturges, relative and cumulative frequency, histogram, ogives and grouped averages.
-
Biostatistics calculator
From a 2×2 table: sensitivity, specificity, predictive values, likelihood ratios, relative risk, odds ratio and NNT with CIs.
One page per field
Each applied calculator collects the formulas of one subject, so you do not have to hunt for a separate tool for every equation. Pick the formula, fill in the values you know, and the page solves for the rest and shows the substitution. Units are part of every input. Mixing kilometres with metres per second is the most common source of wrong answers in physics and engineering.
Worked examples across the fields
- Physics: a ball dropped from rest (u = 0) with g = 9.81 m/s² falls s = ½gt² = 19.62 m in 2 s and reaches v = gt = 19.62 m/s. The physics calculator solves any SUVAT equation from three known values.
- Engineering: 12 V across 4 Ω gives I = V/R = 3 A and a power of P = VI = 36 W, in the engineering calculator.
- Finance: 1,000 invested at 5% a year, compounded annually for 10 years, grows to 1,000 × 1.05¹⁰ = 1,628.89. The financial mathematics calculator also runs this backwards to find a present value.
Where to go for more depth
The last four calculators each overlap with a larger part of the site. For savings, loans and retirement, see the finance calculators. For regression beyond the simple OLS on the econometrics page, see the linear regression calculator. The data analysis calculator builds a full frequency table, and the histogram maker and frequency distribution calculator give more control over the chart. The biostatistics calculator computes everything from one 2×2 table. The sensitivity and specificity and relative risk calculators explain each measure in more detail.
A common mix-up
A test with 90% sensitivity does not mean a positive result is 90% likely to be right. That is the positive predictive value, and it depends on how common the condition is. The biostatistics calculator reports both, so the difference is easy to see.
Guides to read alongside
-
Standard deviation use cases
How spread is measured in manufacturing, laboratories, finance and research.
-
How to interpret standard deviation
Reading a spread in context, whether it is lab measurements or investment returns.
-
Statistics formulas
Reference formulas behind the data analysis and biostatistics tools.