Baseball stats calculator
Choose pitching or batting, enter the counts from the box score or season line, and get ERA and WHIP or AVG, OBP, SLG and OPS with the working shown.
Show the working, step by step
ERA = earned runs × 9 ÷ innings pitched.
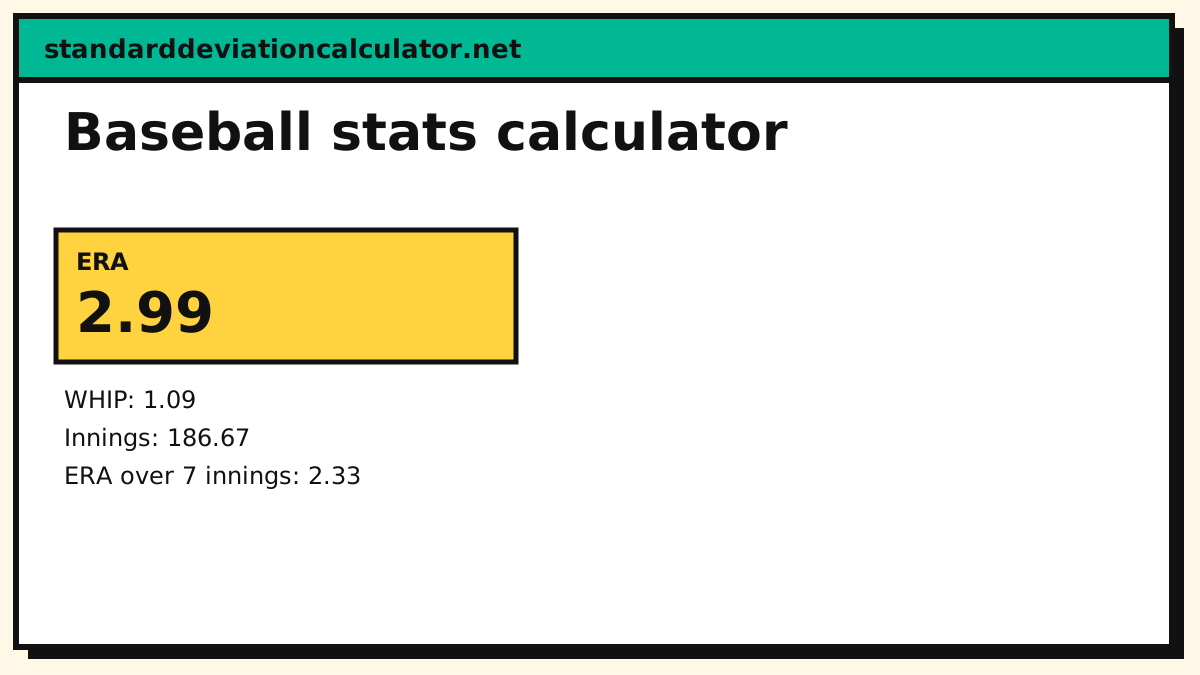
62 × 9 ÷ 186.67 = 2.99
WHIP = (walks + hits) ÷ innings.
(48 + 155) ÷ 186.67 = 1.09
The formulas
ERA = earned runs × 9 ÷ innings pitched WHIP = (walks + hits) ÷ innings pitched AVG = H ÷ AB OBP = (H + BB + HBP) ÷ (AB + BB + HBP + SF) SLG = total bases ÷ AB, OPS = OBP + SLG
Innings are written with outs after the point: 186.2 means 186⅔ innings. For a simpler batting-only tool, see the batting average calculator.
How to use the baseball stats calculator
Pick Pitching to get ERA and WHIP or Batting to get batting average, on-base percentage, slugging and OPS. For pitching, enter earned runs, innings pitched, walks and hits allowed. Write innings with the outs after the decimal point, so 186.2 is 186⅔ innings and 180.1 is 180⅓. For batting, enter at-bats, hits, doubles, triples, home runs, walks, hit by pitch and sacrifice flies. The result shows each rate to three decimals (two for ERA) with the working underneath.
The pitching formulas
ERA = earned runs × 9 ÷ innings pitched WHIP = (walks + hits) ÷ innings pitched
ERA is the earned runs a pitcher would allow over nine innings. WHIP is the number of baserunners allowed by walk or hit per inning. Innings use thirds: an out is one third of an inning, so 186.2 means 186.667 when you do the arithmetic. With 62 earned runs, 186⅔ innings, 48 walks and 155 hits, ERA = 62 × 9 ÷ 186.667 = 2.99 and WHIP = 203 ÷ 186.667 = 1.088.
The batting formulas
AVG = H ÷ AB OBP = (H + BB + HBP) ÷ (AB + BB + HBP + SF) SLG = total bases ÷ AB OPS = OBP + SLG total bases = singles + 2×doubles + 3×triples + 4×home runs
Batting average counts only hits per at-bat. On-base percentage includes walks and hit by pitch, so it measures how often a hitter reaches base. Slugging weights extra-base hits, and OPS adds the two together. Walks and hit by pitch do not count as at-bats, and sacrifice flies appear in the OBP denominator but not as hits.
Worked example: a full batting line
A hitter has 540 at-bats, 155 hits (30 doubles, 2 triples, 24 home runs), 48 walks, 4 hit by pitch and 5 sacrifice flies. Singles are 155 − 30 − 2 − 24 = 99, so total bases are 99 + 60 + 6 + 96 = 261. Then AVG = .287, OBP = 207 ÷ 597 = .347, SLG = 261 ÷ 540 = .483 and OPS = .830. An OPS above .800 is generally very good, and .900 or more is star level.
Pitching examples
- One game: 3 earned runs in 6 innings is 3 × 9 ÷ 6 = 4.50 ERA for that game.
- A complete game shutout: 0 earned runs in 9 innings is a 0.00 ERA. Allowing 1 in 9 is 1.00.
- Partial innings: 6.1 innings is 6⅓, which is 6.333 when computing.
Reading the numbers
A starting pitcher with an ERA under 3.50 and a WHIP near 1.15 is usually doing well. Hitters who bat .300 are strong, an OBP of .370 or more is excellent and a slugging percentage above .500 shows real power. What counts as good changes with the league and era, so compare players against the same season and league. Rate stats from a few games swing wildly, so give small samples little weight.
What these stats leave out
ERA depends on the defence behind a pitcher and on how errors and scoring decisions are recorded. Batting average ignores walks, and OPS counts OBP and SLG equally even though a point of OBP is worth more than a point of slugging. Modern analysis adds park factors, strikeouts, fielding-independent measures and win probability. Use these figures to describe a player’s line, not to settle an argument alone.
Quick reference: what the numbers mean
| Level | AVG | OBP | SLG | OPS |
|---|---|---|---|---|
| Excellent | .300 | .370 | .500 | .900 |
| Good | .280 | .340 | .450 | .800 |
| Average | .250 | .320 | .410 | .730 |
| Weak | .220 | .290 | .350 | .650 |
These bands are rough guides for a recent major-league season. Leagues, ages and eras differ, so they are no substitute for comparing against the right group.
Combining a season from game lines
To get season rates, add the counts first and divide once. Never average per-game averages, because a 4-for-4 game then counts the same as a 0-for-1 game. Sum the hits and at-bats from every game and compute the rate from the totals, in the same way for ERA with total earned runs and total innings (in thirds).
Sample-size and league context
A hitter who goes 3 for 10 is batting .300, but ten at-bats say almost nothing about talent; a full season of about 500 at-bats is much more reliable. The same holds for ERA, where a single bad outing of 7 earned runs in 2 innings produces a 31.50 ERA that shrinks fast over a season. When comparing players from different years, look at how they stood relative to the league that season rather than raw numbers alone.
Common mistakes and limits
- Reading 186.2 as 186.2 innings. The digit after the point is outs, not tenths.
- Counting walks as at-bats. Walks and hit by pitch are plate appearances but not at-bats.
- Using all runs instead of earned runs. ERA counts earned runs only.
- Entering hits as only singles. Hits include doubles, triples and home runs.
Common questions
How is ERA calculated?
Multiply earned runs by 9 and divide by innings pitched: 62 earned runs in 186⅔ innings is 2.99.
What does 180.2 innings mean?
The digit after the point counts outs, not tenths: 180.2 is 180⅔ innings, because three outs make an inning.
What is a good OPS?
League average is usually around .700 to .750; .800 is good and .900 or above is excellent.
How is ERA calculated?
Multiply earned runs by 9 and divide by innings pitched. 62 earned runs over 186⅔ innings is 2.99.
What is a good WHIP?
Below 1.20 is good and below 1.00 is elite for a starter. The league average is usually around 1.25 to 1.35.
How do I calculate OPS?
Add on-base percentage and slugging percentage. An OBP of .347 and a SLG of .483 gives an OPS of .830.
Why does innings pitched use .1 and .2?
Baseball records outs as thirds of an inning, so .1 is one out (⅓) and .2 is two outs (⅔). The calculator converts them before dividing.
What is the difference between AVG and OBP?
Batting average counts hits per at-bat, while on-base percentage also credits walks and hit by pitch, so it shows how often a batter avoids making an out.
Are earned runs the same as runs allowed?
No. Earned runs exclude runs that scored because of errors or passed balls, which is why ERA is often lower than runs allowed per nine innings.
Related calculators
-
Batting average
AVG only.
-
Mean calculator
Season averages.
-
Standard deviation calculator
Consistency of a player.
-
Percentage calculator
Rates and shares.