Statistics
Test score standard deviation calculator
Paste a column of scores from your gradebook to see how spread out the class was. The calculator opens in population mode, because a teacher describing one class usually has every score. Open the working for each student's z-score.
Separate numbers with commas, spaces or new lines, or paste a spreadsheet column.
Decimals and negatives are fine; write 10:3 for a value that occurs 3 times.
Your results will appear here: the standard deviation first, then the rest of the summary and a chart.
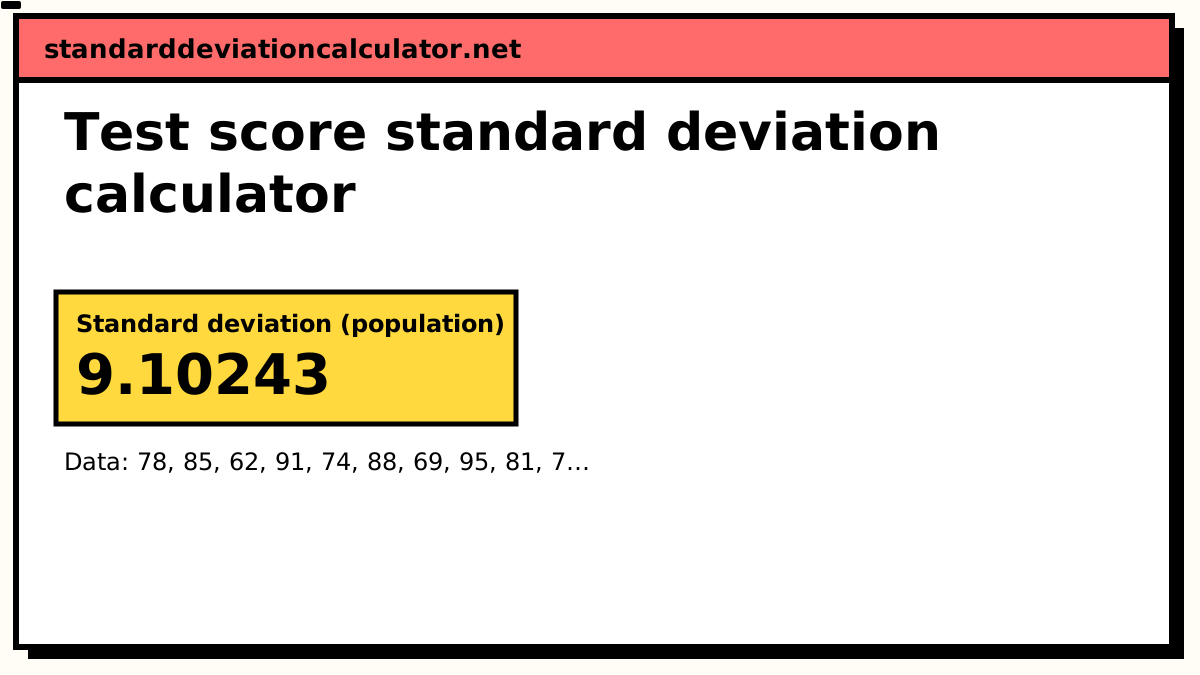
Standard deviation (population)
9.10243
9.10
Your values typically sit about 9.1 above or below their mean of 79.75, in the same units as your data. 8 of 12 values (67%) fall between 70.65 and 88.85, within one standard deviation of the mean; for normally distributed data about 68% would.
Sample SD (s): 9.50717, if these values are a sample from a larger group.
- Count (n)
- 12
- Mean (x̄)
- 79.75
- Variance (σ²)
- 82.8542
- Standard error
- 2.62764
- Minimum
- 62
- Q1 (25%)
- 73.75
- Median
- 79.5
- Q3 (75%)
- 85.75
- Maximum
- 95
- Range
- 33
More statistics (5)
- Relative SD (%RSD)
- 11.4137%
- Coefficient of variation
- 0.114137
- Sum (Σx)
- 957
- Sum of squares, Σ(x − x̄)²
- 994.25
- IQR (Q3 − Q1)
- 12
Data distribution
Shaded bands mark ±1, ±2 and ±3 SD from the mean. 8 of 12 values (67%) fall within ±1 SD.
Chart as text
Mean 79.75, population standard deviation σ = 9.10243, from 12 values between 62 and 95.
- Within ±1 SD (70.65 to 88.85): 8 of 12 values (67%). About 68% for normal data.
- Within ±2 SD: 12 (100%). About 95% for normal data.
- Within ±3 SD: 12 (100%). About 99.7% for normal data.
Show the working, step by step
What the standard deviation says about a test
The mean tells you how hard the test was; the standard deviation tells you how well it separated students. Two classes can both average 80 and have had completely different experiences:
| Class | Mean | SD (σ) | Lowest–highest |
|---|---|---|---|
| Class A (the default data) | 79.75 | 9.10 | 62–95 |
| Class B (tightly bunched) | 79.83 | 1.67 | 77–83 |
In class B every student scored within six points of every other. Either the class genuinely learned the material evenly, or the test could not tell strong students from weak ones — often a sign of questions that were too easy or too similar. Class A's spread is what most teachers expect from a well-pitched exam.
Worked example: one class, one exam
Twelve students score 78, 85, 62, 91, 74, 88, 69, 95, 81, 73, 84, 77 out of
100. Treating the class as the whole group:
- Sum = 957, so the mean is 957 ÷ 12 = 79.75.
- The squared deviations from 79.75 add to 994.25.
- Divide by N = 12 for the population variance: 82.8542.
- σ = √82.8542 = 9.10243 points.
So a typical student scored about 9 points from the class average. Eight of the twelve (67%) fall within one SD, between 70.6 and 88.9 — close to the 68% a bell curve would predict. If you would rather treat the class as a sample of all students who take the course, switch to sample mode: s = 9.50717.
Z-scores: where each student stands
z = (score − mean) ÷ SD
The top score, 95, has z = (95 − 79.75) ÷ 9.10243 = 1.68. The lowest, 62, has z = −1.95. Neither passes the usual |z| > 3 threshold, so no score is an outlier; the working lists a z for every student. Z-scores also let you compare a student across tests on different scales — a z of +1 on a quiz out of 20 is as strong a result as a z of +1 on a 100-point exam. The z-score calculator turns any z into a percentile.
Curving with the mean and standard deviation
To rescale scores so the class averages 75 with an SD of 10, convert each score to a z and map it back:
new score = 75 + 10 × z
The 62 becomes 75 + 10 × (−1.95) = 55.5, and the 95 becomes 91.8. Every student keeps their position relative to the class. The bell curve generator draws the curve for any mean and SD if you want to see the new distribution.
Comparing classes and tests fairly
- Same test, different classes: compare the SDs directly. Both are in points.
- Different maximum scores: divide each SD by the maximum first, or use the coefficient of variation.
- Small classes: with fewer than about ten students, one absent or unusual student can swing the SD a lot. Look at the range and the individual z-scores too.
- A student's own average across several assignments is a different question; the grade average calculator handles that.
For any other kind of data the general standard deviation calculator and the variance calculator work the same way.
Related calculators
-
Standard deviation calculator
The general SD tool for any kind of data.
-
Z-score calculator
Where one student sits relative to the class, as a percentile.
-
Bell curve generator
Draw the normal curve for your class mean and SD.
-
Grade average
The mean of a student’s scores across assignments.
Common questions
What is a good standard deviation for test scores?
It depends on what the test is for. On a 100-point classroom exam, an SD of roughly 8 to 15 points is common and means the test separated students without being brutal. Below about 5, nearly everyone scored alike, so the test told you little about who knows what. Above about 20, look for a bimodal split — a group that understood the material and a group that did not.
Should I use sample or population standard deviation for my class?
If you are describing this class's results, the class is the whole group and the population SD is the natural choice. If you are treating the class as a sample of students who take the course — to judge the test itself, or compare with other years — use the sample SD. With 25 or more students the two differ by about 2% or less.
How do I find how many standard deviations a student scored above the mean?
Compute the z-score: z = (score − mean) ÷ SD. A student with 95 in a class
averaging 79.75 with an SD of 9.10 has z = 1.68, about one and two-thirds SDs above
average. The z-score calculator converts that into a
percentile.
How can I use the standard deviation to curve grades?
One common method rescales every score to a chosen mean and SD:
new = target mean + target SD × z. It preserves each student's standing
relative to the class. Whether to curve at all, and to what targets, is a policy decision
rather than a statistical one.
Can I compare standard deviations from tests with different maximum scores?
Not directly: an SD of 3 on a 20-point quiz and 12 on a 100-point exam are on different scales. Divide each SD by the maximum score (15% and 12%), or compare coefficients of variation, before judging which test spread students out more.