Math
Grade average calculator
Your grade average is the sum of your scores divided by how many there are. Paste in your test, quiz or homework scores to get it, along with the median, the spread of your results and the working.
Separate numbers with commas, spaces or new lines, or paste a spreadsheet column.
Decimals and negatives are fine; write 10:3 for a value that occurs 3 times.
Your results will appear here: the result first, then the rest of the summary and a chart.
Mean (average)
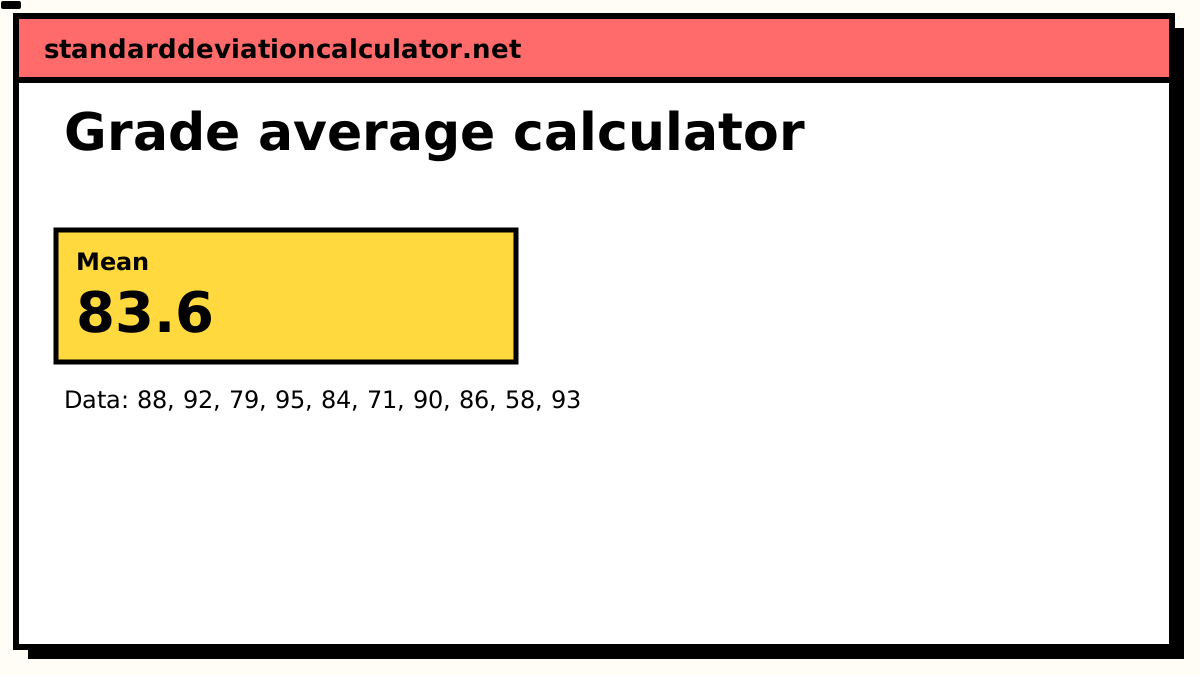
83.6
Data distribution
Shaded bands mark ±1, ±2 and ±3 SD from the mean. 8 of 10 values (80%) fall within ±1 SD.
Chart as text
Mean 83.6, sample standard deviation s = 11.5007, from 10 values between 58 and 95.
- Within ±1 SD (72.1 to 95.1): 8 of 10 values (80%). About 68% for normal data.
- Within ±2 SD: 9 (90%). About 95% for normal data.
- Within ±3 SD: 10 (100%). About 99.7% for normal data.
Show the working, step by step
How a grade average is calculated
average = (sum of scores) ÷ (number of scores)
Every score counts equally. That fits a set of quizzes that are all worth the same. It does not fit a course grade where the final exam is worth 40% and homework 10%. For that you need a weighted average (below).
A worked example
Ten scores from one term: 88, 92, 79, 95, 84, 71, 90, 86, 58, 93.
- Add them: 88 + 92 + 79 + 95 + 84 + 71 + 90 + 86 + 58 + 93 = 836.
- Count them: n = 10.
- Divide: 836 ÷ 10 = 83.6.
The median is 87, higher than the mean. The 58 is well below every other score and pulls the mean down on its own. These are the numbers loaded into the calculator above.
Dropping the lowest score
Many courses drop each student's lowest quiz or homework score. To see what that does, delete the lowest value and recalculate:
| Rule | Scores used | Sum | Average |
|---|---|---|---|
| All scores | 10 | 836 | 83.6 |
| Drop the lowest (58) | 9 | 778 | 86.4 |
| Drop the highest and lowest (95, 58) | 8 | 683 | 85.4 |
The last row is a trimmed mean, and the calculator reports it as the "10% trimmed mean". It removes 10% of the scores from each end, which for ten scores means the single highest and single lowest. With fewer than ten scores, 10% rounds down to none, so the trimmed mean equals the plain mean. In that case, drop the scores by hand.
When the plain average is the wrong number
Suppose the syllabus weights tests at 50%, quizzes at 30% and homework at 20%. Use the same ten scores, split into categories:
| Category | Scores | Category average | Weight |
|---|---|---|---|
| Tests | 88, 92 | 90 | 50% |
| Quizzes | 79, 95, 84 | 86 | 30% |
| Homework | 71, 90, 86, 58, 93 | 79.6 | 20% |
0.5 × 90 + 0.3 × 86 + 0.2 × 79.6 = 86.72
The weighted grade is 86.72, more than three points above the plain average of 83.6. The difference comes from the homework. It has the most scores, including the 58, but carries the least weight. Use the weighted average calculator whenever categories carry different percentages.
Converting the average to a letter grade
Cut-offs are set by each school or instructor, so check your syllabus. A common US scale is:
| Letter | Percentage | GPA points |
|---|---|---|
| A | 90–100 | 4.0 |
| B | 80–89 | 3.0 |
| C | 70–79 | 2.0 |
| D | 60–69 | 1.0 |
| F | below 60 | 0.0 |
Many schools add plus and minus grades (a B+ is often 87–89 and 3.3 points). On this scale the example's 83.6 is a B. Some instructors round 89.5 up to an A and some do not; that is a policy choice, not arithmetic. To average GPA points across courses with different credit hours, weight each course by its credits.
How consistent are your grades?
The standard deviation shows how far your scores typically sit from your average. For the example set it is 11.5 points (sample). Without the 58 it falls to 7.6. One outlier inflates the spread as much as it lowers the average. The standard deviation calculator shows the full working.
Related calculators
-
Weighted average
When tests, quizzes and homework count for different percentages of the grade.
-
Test score SD
How spread out a whole class’s scores are.
-
Median
The middle score, which one bad day cannot drag down.
-
Percentile
Where a score sits relative to the rest of the class.
Common questions
How do I calculate my grade average?
Add all your scores and divide by how many there are. For 88, 92, 79, 95, 84, 71,
90, 86, 58, 93 the total is 836 over 10 scores, so the average is
83.6.
That only works when every score counts equally. If tests, quizzes and homework carry different percentages of the final grade, use the weighted average calculator instead.
How do I average grades that are out of different totals?
Convert each one to a percentage first: 18 out of 20 is 90%, and 41 out of 50 is 82%. Averaging the raw marks, or adding the points up, gives the bigger assignment more say. That is correct only if your syllabus says points are pooled. Check which rule your course uses.
What does dropping the lowest score do to my average?
Remove the lowest score and average the rest. In the example set, dropping the 58 leaves 778 over 9 scores, so the average rises from 83.6 to 86.4. One low score costs more when there are few scores in total.
Why does the calculator show a standard deviation for grades?
It measures how consistent the scores are. Two students can both average 80: one scoring 78–82 every time, the other swinging between 60 and 100. The first has a standard deviation near 2, the second near 20. Teachers use the same figure to describe how spread out a class is. The test score standard deviation calculator covers that use.
Is the median a better grade average than the mean?
The median is the middle score, so a single very low or very high mark barely moves it. For the example set it is 87, above the mean of 83.6, because the 58 pulls the mean down. Report cards almost always use the mean, but the median is a fairer picture of a typical result when one score is out of line.