Math
Range calculator
The range of a data set is its largest value minus its smallest — the full width the data covers. Paste your numbers to get the range, with the IQR and standard deviation alongside so you can see whether the range is telling the whole story.
Separate numbers with commas, spaces or new lines, or paste a spreadsheet column.
Decimals and negatives are fine; write 10:3 for a value that occurs 3 times.
Your results will appear here: the result first, then the rest of the summary and a chart.
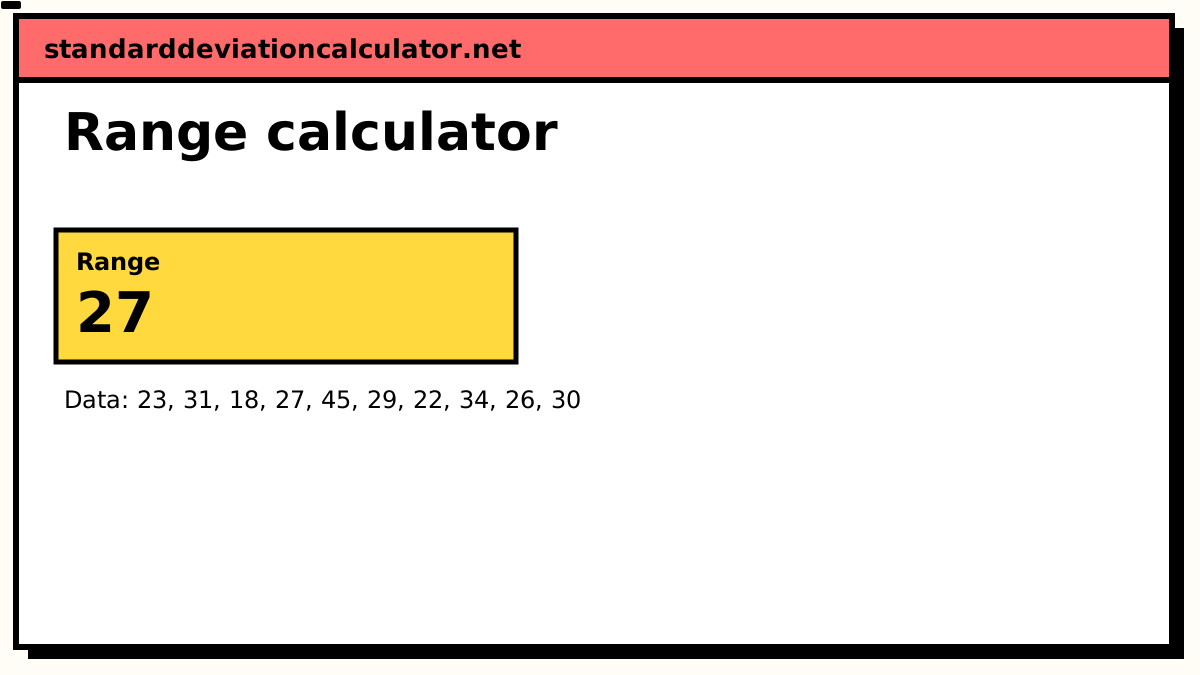
Range
27
Data distribution
Shaded bands mark ±1, ±2 and ±3 SD from the mean. 8 of 10 values (80%) fall within ±1 SD.
Chart as text
Mean 28.5, sample standard deviation s = 7.47217, from 10 values between 18 and 45.
- Within ±1 SD (21.03 to 35.97): 8 of 10 values (80%). About 68% for normal data.
- Within ±2 SD: 9 (90%). About 95% for normal data.
- Within ±3 SD: 10 (100%). About 99.7% for normal data.
Show the working, step by step
The formula
range = maximum − minimum
The range is in the same units as the data. A range of 27 minutes means the slowest and fastest times were 27 minutes apart; it says nothing about where the other values sit between them.
A worked example
Ten commute times, in minutes: 23, 31, 18, 27, 45, 29, 22, 34, 26, 30 — the
data loaded above.
- Sort them: 18, 22, 23, 26, 27, 29, 30, 31, 34, 45.
- The minimum is 18 and the maximum is 45.
- Range = 45 − 18 = 27 minutes.
The standard deviation of the same times is 7.47217 (sample) and the interquartile range is 7, from Q1 = 23.75 to Q3 = 30.75.
Range versus IQR versus standard deviation
The example contains one slow day, 45 minutes. Drop it and see what each measure of spread does:
| Measure | All 10 values | Without 45 | Change |
|---|---|---|---|
| Range | 27 | 16 | −41% |
| Standard deviation (s) | 7.47 | 5.00 | −33% |
| Interquartile range | 7 | 7 | 0% |
The range moves the most because it is built from the one value that changed. The standard deviation moves too, since it squares every deviation. The IQR, which only looks at the middle half, does not move at all. Which one you want depends on the question:
- Range — when the extremes are the point: tolerances, the spread of prices on offer, the gap between the best and worst result.
- IQR — when the data is skewed or has outliers, and you want the typical spread. It pairs with the median.
- Standard deviation — for roughly symmetric data, and whenever the next step is a z-score, confidence interval or test. It pairs with the mean.
The range rule of thumb
For roughly normal data, most values fall within two standard deviations of the mean, so the range covers about four standard deviations:
s ≈ range ÷ 4
Here that gives 27 ÷ 4 = 6.75, against an actual 7.47. The rule assumes around 20–30 values: bigger samples reach further into the tails and cover more standard deviations, smaller ones fewer. The calculator reports the range divided by the SD so you can see the ratio for your own data (3.61 here). For an estimate adjusted for sample size, use the range estimator.
Why the range grows with sample size
Every new value can only widen the range, never narrow it. A sample of 10 from a population will usually have a smaller range than a sample of 1,000 from the same population, even though the population's spread has not changed. That makes ranges from samples of different sizes hard to compare, and it is the main reason statistics prefers the standard deviation, which does not systematically grow with n.
Range in Excel and Google Sheets
| What you want | Formula |
|---|---|
| Range | =MAX(A2:A11)-MIN(A2:A11) |
| Interquartile range | =QUARTILE.INC(A2:A11,3)-QUARTILE.INC(A2:A11,1) |
| Rule-of-thumb SD | =(MAX(A2:A11)-MIN(A2:A11))/4 |
Related calculators
-
Min and max calculator
The extremes themselves: ties, second-smallest, midrange and spec checks.
-
IQR and outliers
The range of the middle half, which one outlier cannot move.
-
Standard deviation calculator
The spread measure that uses every value, not just the two ends.
-
Five-number summary
Min, Q1, median, Q3 and max as a box plot.
Common questions
How do you find the range of a data set?
Subtract the smallest value from the largest: range = max − min. For
23, 31, 18, 27, 45, 29, 22, 34, 26, 30 the largest value is 45 and the smallest 18, so the
range is 27.
Can the range be negative?
No. The maximum is never smaller than the minimum, so the range is always 0 or more. It is 0 only when every value is the same. A negative result means the subtraction was done the wrong way round.
Is the range a good measure of spread?
It is the quickest, but the least reliable. It depends on only two values, so a single outlier sets it, and it tends to grow as you collect more data. The interquartile range and the standard deviation use more of the data and are steadier.
How do I calculate the range in Excel?
There is no RANGE function. Use =MAX(A2:A11)-MIN(A2:A11). In Google Sheets the
same formula works.
Can I estimate the standard deviation from the range?
Roughly. The rule of thumb is s ≈ range ÷ 4, which works for about 20–30
roughly normal values. For other sample sizes the divisor changes; the
range estimator adjusts it for n.