Dispersion calculator
Paste a list of numbers and get every common measure of dispersion side by side, from the range to the standard deviation and the index of dispersion, with the working for each.
Separate with commas, spaces or new lines.
Methods differ slightly on small data sets; the fences move with them.
| Measure | Value | Formula |
|---|---|---|
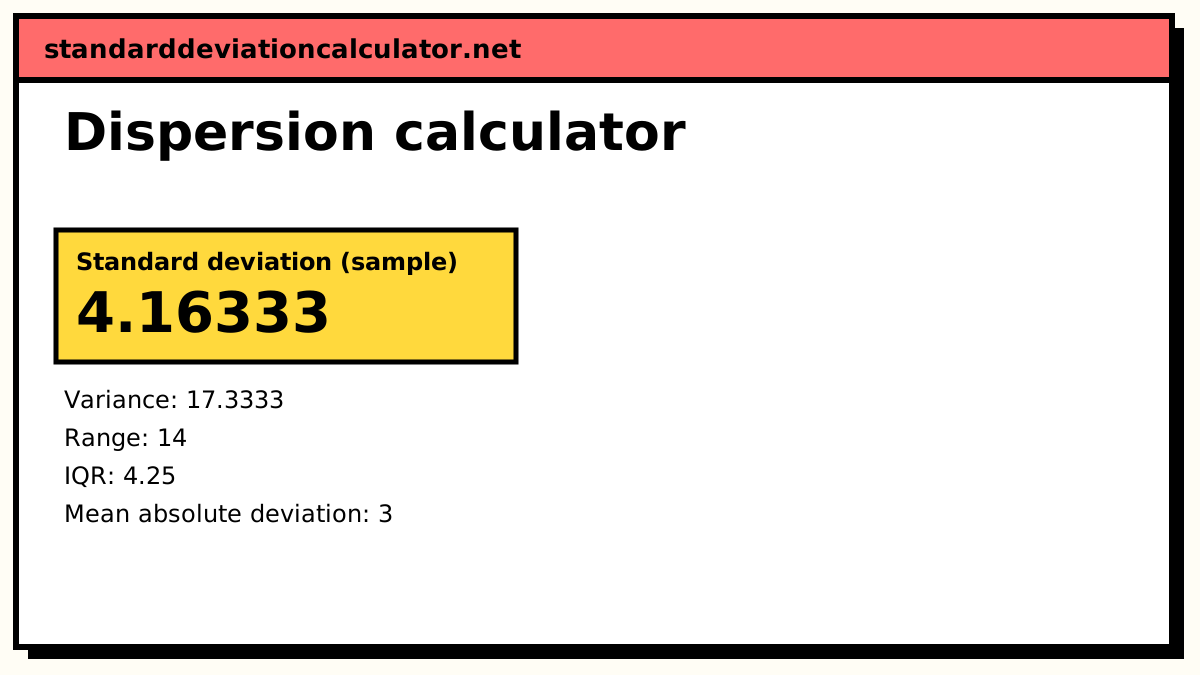
| Range | 14 | max − min |
| Coefficient of range | 0.3889 | (max − min) ÷ (max + min) |
| Interquartile range (IQR) | 4.25 | Q₃ − Q₁ |
| Quartile deviation | 2.125 | (Q₃ − Q₁) ÷ 2 |
| Coefficient of quartile deviation | 0.1382 | (Q₃ − Q₁) ÷ (Q₃ + Q₁) |
| Mean absolute deviation (about the mean) | 3 | Σ|x − x̄| ÷ n |
| Mean absolute deviation (about the median) | 3 | Σ|x − M| ÷ n |
| Median absolute deviation | 2.5 | median |x − M| |
| Variance (sample) | 17.3333 | Σ(x − x̄)² ÷ (n − 1) |
| Standard deviation (sample) | 4.16333 | √variance |
| Coefficient of variation | 26.02% | s ÷ |x̄| |
| Index of dispersion | 1.083 | s² ÷ x̄ |
The shaded band runs from Q₁ to Q₃ (the IQR). x̄ is the mean, M the median.
Show the working, step by step
Sort the data.
11, 12, 13, 14, 15, 16, 16, 18, 20, 25
Range and coefficient of range.
range = 25 − 11 = 14 coefficient = 14 ÷ 36 = 0.3889
Quartiles by (n − 1) interpolation.
Q₁ = 3rd item + 0.25 × (4th item − 3rd item) = 13 + 0.25 × (14 − 13) = 13.25 Q₃ = 7th item + 0.75 × (8th item − 7th item) = 16 + 0.75 × (18 − 16) = 17.5
IQR and quartile deviation.
IQR = 17.5 − 13.25 = 4.25 QD = 4.25 ÷ 2 = 2.125
Mean and mean absolute deviation.
x̄ = 160 ÷ 10 = 16 Σ|x − x̄| ÷ n = 30 ÷ 10 = 3
Variance and standard deviation (sample).
Σ(x − x̄)² = 156 s² = 156 ÷ 9 = 17.3333 s = √17.3333 = 4.16333
Relative measures.
CV = 4.16333 ÷ 16 = 26.02% index of dispersion = 17.3333 ÷ 16 = 1.083
Absolute measures (range, IQR, MAD, SD) are in the units of the data. The coefficients and the CV have no units, so they compare spread across data sets. The index of dispersion is meant for counts: about 1 for Poisson-like counts, above 1 when they are clumped, below 1 when they are more even.
The formulas
range = max − min coefficient of range = (max − min) ÷ (max + min) IQR = Q₃ − Q₁ quartile deviation = (Q₃ − Q₁) ÷ 2 mean absolute deviation = Σ|x − x̄| ÷ n s² = Σ(x − x̄)² ÷ (n − 1) s = √s² CV = s ÷ x̄ index of dispersion = s² ÷ x̄
A worked example
The default data are ten values: 12, 15, 11, 18, 14, 20, 16, 13, 25, 16. Sorted, they run 11, 12, 13, 14, 15, 16, 16, 18, 20, 25.
- Range = 25 − 11 = 14, and the coefficient of range = 14 ÷ 36 = 0.3889.
- With the (n − 1) interpolation method, Q₁ = 13.25 and Q₃ = 17.5, so IQR = 4.25 and the quartile deviation is 2.125. The coefficient of quartile deviation is 4.25 ÷ 30.75 = 0.1382.
- The mean is 160 ÷ 10 = 16. The absolute deviations from 16 add to 30, so the mean absolute deviation is 3. The median absolute deviation, from the median 15.5, is 2.5.
- The squared deviations add to 156. The sample variance is 156 ÷ 9 = 17.33 and the sample standard deviation is √17.33 = 4.163.
- CV = 4.163 ÷ 16 = 26.02%, and the index of dispersion is 17.33 ÷ 16 = 1.083.
How to read the results
The absolute measures answer "how far apart are typical values, in the data's own units". In the example a typical value sits about 3 to 4 units from the centre, whether you use the mean absolute deviation (3) or the standard deviation (4.16). The standard deviation is always at least as large as the mean absolute deviation, because squaring gives the larger deviations more weight. Here the single value 25 accounts for 81 of the 156 in the sum of squares.
The relative measures answer "how spread out compared with the size of the values". A CV of 26% means the standard deviation is about a quarter of the mean. Use these to compare, say, the variability of heights with the variability of weights, which have different units.
If the range is large but the IQR is small, most values are tightly packed and one or two are far out: check the dot plot for outliers before trusting the variance.
Common mistakes
- Using the population formula (÷ n) for sample data, which understates the variance.
- Comparing standard deviations of variables with different units or very different means. Compare CVs instead.
- Reporting a CV or coefficient of range for data that can be negative, such as temperatures in °C. The ratios only make sense for positive values on a scale with a true zero.
- Confusing the mean absolute deviation with the median absolute deviation. Both are abbreviated MAD.
Common questions
What are the measures of dispersion?
Numbers that describe how spread out data are. The absolute measures (range, interquartile range, quartile deviation, mean absolute deviation, variance and standard deviation) are in the units of the data. The relative measures (coefficient of range, coefficient of quartile deviation, coefficient of variation) are ratios with no units, used to compare data sets.
Which measure of dispersion is best?
The standard deviation for roughly symmetric data without outliers, because it uses every value and underlies most statistical tests. The IQR or the median absolute deviation when the data are skewed or have outliers, because one extreme value barely moves them. The range is quick but depends on only two values.
What is the index of dispersion?
The variance divided by the mean, also called the variance-to-mean ratio. It is used for counts: for Poisson counts (random, independent events) it is about 1, above 1 means the counts are clumped (overdispersed), and below 1 means they are more regular than random. For the default data it is 17.33 ÷ 16 = 1.083.
Why does the IQR change with the quartile method?
There are several accepted ways to locate quartiles in a list, and they give slightly different answers on small data sets. For the default data, Excel's QUARTILE.INC gives Q₁ = 13.25, QUARTILE.EXC gives 12.75, and the TI-84's median-of-halves method gives 13. Pick the method your course or software uses.
Should I choose sample or population?
Sample if the data are a sample from something larger and you want to estimate its spread (the usual case); population if the data are the whole group you care about. The choice only affects the variance, standard deviation, CV and index of dispersion.
Related calculators
-
Descriptive statistics calculator
Centre, spread and shape of a data set together.
-
Coefficient of variation calculator
Standard deviation as a percentage of the mean.
-
Quartile deviation calculator
Semi-interquartile range for lists and grouped data.