Standard deviation index calculator
Enter your laboratory's mean for a control, the peer group mean and the peer group SD. The calculator gives the standard deviation index, rates it, and, if you add your own SD, compares your precision with the peers'.
┄ ±2 SDI
Show the working, step by step
Subtract the peer group mean from your mean to get the bias.
102 − 100 = 2
Divide by the peer group SD.
SDI = 2 ÷ 2.5 = 0.8
CV ratio: your CV divided by the peer CV.
(2.2 ÷ 102) ÷ (2.5 ÷ 100) = 0.863
SDI measures accuracy (bias against peers); the CV ratio measures precision. The rating bands shown are the ones most QC programmes use, but follow your own programme’s limits.
The formula
SDI = (lab mean − peer group mean) ÷ peer group SD CVR = (lab SD ÷ lab mean) ÷ (peer SD ÷ peer mean)
The numerator is your bias against the consensus. Dividing by the spread between labs turns it into a unit-free number that can be compared across analytes, control levels and months.
A worked example
A lab's monthly mean for a glucose control is 102 mg/dL. The peer group of labs using the same instrument and reagent reports a mean of 100 mg/dL with an SD of 2.5 mg/dL.
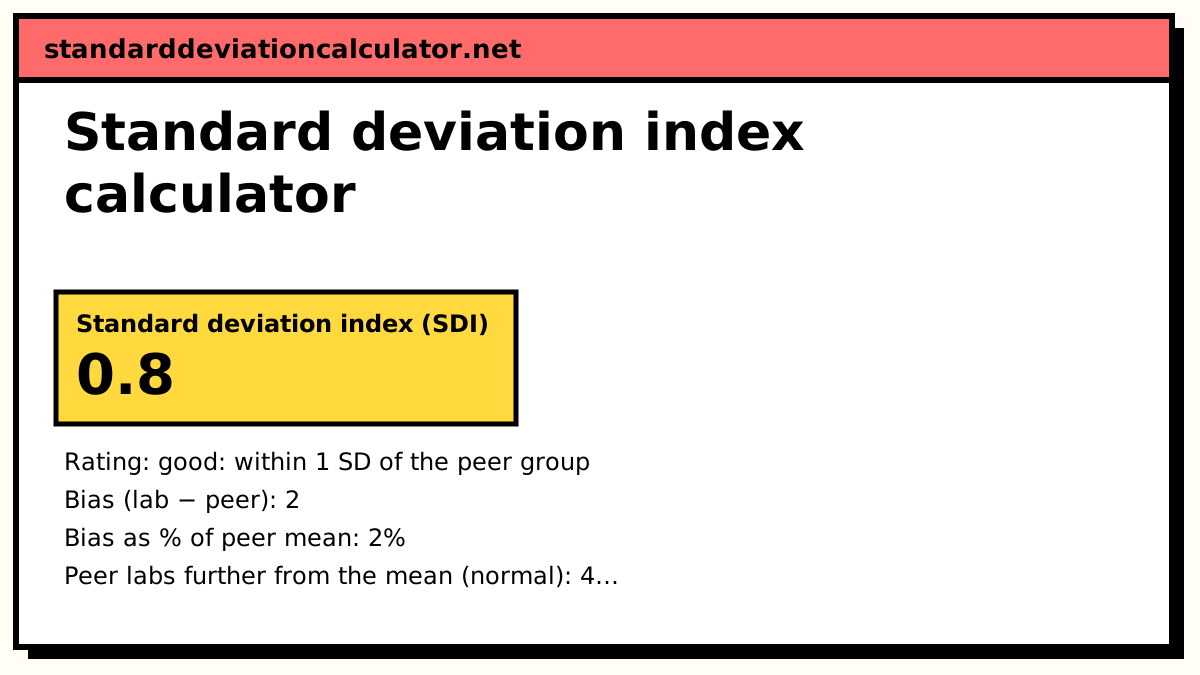
SDI = (102 − 100) ÷ 2.5 = 2 ÷ 2.5 = 0.8
The lab reads 2 mg/dL (2%) high, which is 0.8 of a peer SD. That is within ±1, so it rates as good. If the peer results are roughly normal, about 42% of labs are further from the consensus than this one.
The lab's own SD for the month is 2.2 mg/dL, so its CV is 2.2 ÷ 102 = 2.16%, against the peer CV of 2.5 ÷ 100 = 2.5%. The CV ratio is 2.16 ÷ 2.5 = 0.863: the lab is slightly more precise than its peers.
Interpreting the SDI
SDI answers the accuracy question: is our result in line with other labs doing the same test? A single SDI around 1.5 is not alarming on its own, since some lab has to be at the edges of the distribution. What deserves attention is a pattern: SDIs that stay on the same side of zero for several months (a systematic bias, often calibration), SDIs that drift steadily in one direction (a deteriorating reagent or instrument), or several control levels moving together.
The CV ratio answers the precision question. A lab can have a good SDI with a poor CVR (accurate on average but noisy) or the reverse. Look at both before deciding whether to act.
The SDI depends on the peer group. A small peer group has an unstable SD, and a peer group that mixes methods has a large SD that makes every lab look good. Compare against the narrowest peer group with enough participants.
Common mistakes
- Dividing by your own lab's SD instead of the peer group SD.
- Subtracting in the wrong order, which flips the sign and hides the direction of bias.
- Judging a single month in isolation instead of watching the trend.
- Comparing against a peer group that uses a different method or instrument.
Common questions
What is the standard deviation index (SDI)?
A laboratory quality control statistic that measures how far a lab's result is from its peer group, in units of the peer group's standard deviation: SDI = (lab mean − group mean) ÷ group SD. It is a z-score for the lab. An SDI of 0 means perfect agreement with the peers.
What is an acceptable SDI?
Most peer-comparison and proficiency testing programmes treat |SDI| ≤ 1 as good, 1 to 1.5 as acceptable, 1.5 to 2 as marginal and worth investigating, and above 2 as unacceptable. Some programmes set the action limit at 2, others at 3, and trends over several months matter as much as any single value. Follow the limits in your own programme's rules.
What does a negative SDI mean?
Your lab's result is below the peer group mean. The sign shows the direction of the bias; the size shows how large it is relative to the normal spread between labs.
What is the CV ratio (CVR or CVI)?
Your lab's coefficient of variation divided by the peer group's CV. It compares precision rather than accuracy. A CVR below 1 means your results are less variable than the peer group's; above 1, more variable. Many programmes flag CVRs above about 1.5 or 2.
Is SDI the same as a z-score in proficiency testing?
The formula is the same. In proficiency testing (ISO 13528) the z-score often uses an assigned value and a fixed "standard deviation for proficiency assessment" rather than the observed peer SD, and the usual limits are |z| ≤ 2 satisfactory, 2 to 3 questionable, above 3 unsatisfactory.
Related calculators
-
Z-score calculator
The same standardisation for any value, mean and SD.
-
Coefficient of variation calculator
The CV behind the CV ratio.
-
Relative standard deviation calculator
RSD (%CV) for replicate measurements.