Process capability index calculator
Paste your measurements in time order, or enter the mean and standard deviations, with the specification limits. The calculator returns all six capability indices, the expected defect rate and a chart of the process against the limits.
Order matters: the within-process σ comes from the ranges between consecutive values.
| Short-term (within σ) | Long-term (overall σ) | ||
|---|---|---|---|
| Cp | 1.73 | Pp | 1 |
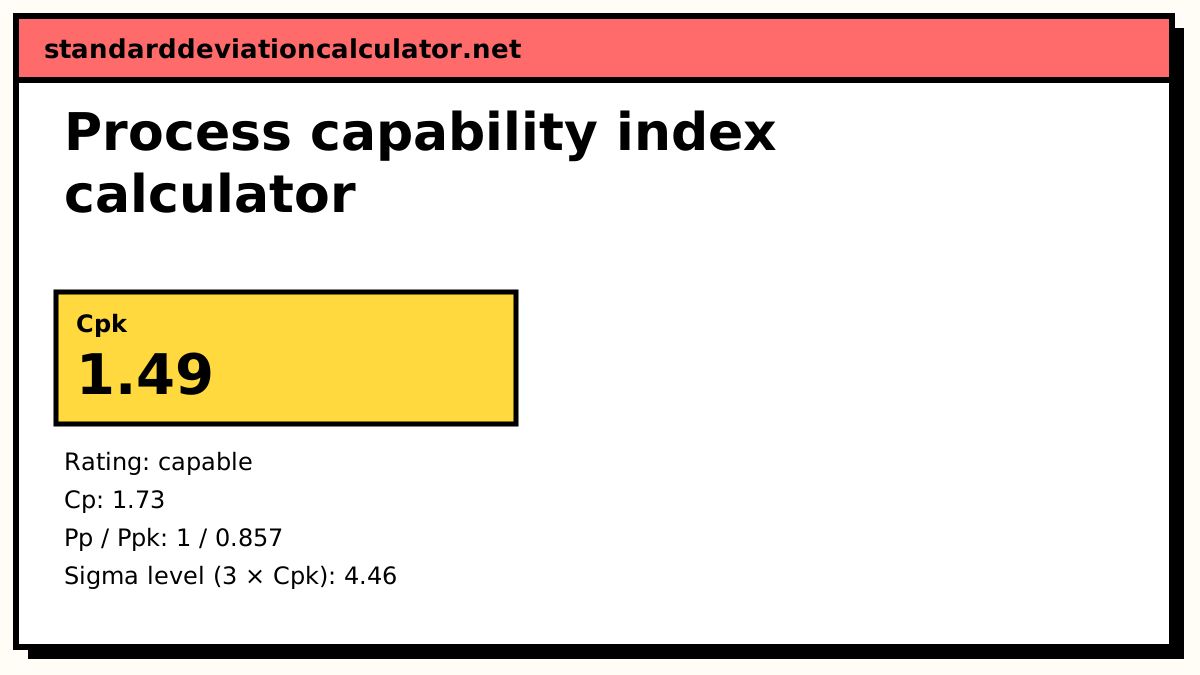
| Cpk | 1.49 | Ppk | 0.857 |
| Cpu | 1.49 | Ppu | 0.857 |
| Cpl | 1.98 | Ppl | 1.14 |
| Expected ppm out of spec | 4.089 | ppm | 5382 |
━ within σ ┄ overall σ ━ LSL and USL
Show the working, step by step
Mean and overall (long-term) SD of all the measurements.
x̄ = 10.01 σoverall = s = 0.0233415
Within (short-term) SD from the average moving range between consecutive values.
MR̄ = 0.0151724 σwithin = MR̄ ÷ d₂ = 0.0151724 ÷ 1.128 = 0.0134507
Cp compares the specification width with six within-σ.
Cp = (USL − LSL) ÷ 6σ = (10.07 − 9.93) ÷ (6 × 0.0134507) = 1.735
One-sided indices: distance from the mean to each limit in units of 3σ.
Cpu = (10.07 − 10.01) ÷ (3 × 0.0134507) = 1.487 Cpl = (10.01 − 9.93) ÷ (3 × 0.0134507) = 1.983
Cpk is the smaller one-sided index.
Cpk = 1.487
Pp and Ppk are the same formulas with the overall σ.
Ppk = 0.8568, Pp = 0.9996
Expected fraction out of specification, assuming a normal process.
ppm = 10⁶ × [(1 − Φ(4.461)) + Φ(−5.948)] = 4.089 3 × Cpk = 4.46 (nearest limit is 4.46 σ away)
Cpk = 1.49 means the nearer limit is 4.46 within-σ from the mean, about 4.09 ppm beyond that limit alone.
The formulas
Cp = (USL − LSL) ÷ 6σwithin Cpu = (USL − μ) ÷ 3σwithin Cpl = (μ − LSL) ÷ 3σwithin Cpk = min(Cpu, Cpl) Pp, Ppk: the same with σoverall σwithin = MR̄ ÷ 1.128 σoverall = sample SD of all values
A worked example
The default data are 30 shaft diameters in mm, measured in production order, with specification limits LSL = 9.93 and USL = 10.07.
- The mean is 10.01 and the overall sample SD is 0.02334.
- The 29 moving ranges average MR̄ = 0.01517, so σwithin = 0.01517 ÷ 1.128 = 0.01345.
- Cp = (10.07 − 9.93) ÷ (6 × 0.01345) = 0.14 ÷ 0.0807 = 1.73.
- Cpu = (10.07 − 10.01) ÷ (3 × 0.01345) = 1.49 and Cpl = (10.01 − 9.93) ÷ (3 × 0.01345) = 1.98, so Cpk = 1.49.
- With the overall SD instead: Pp = 0.14 ÷ (6 × 0.02334) = 1.00 and Ppk = 0.06 ÷ (3 × 0.02334) = 0.86.
From the within σ the process is capable (Cpk 1.49 > 1.33), with about 4 ppm expected out of specification. From the overall σ it is not (Ppk 0.86 < 1), with about 5,400 ppm.
Interpreting the gap
The data drift: the diameters climb from about 9.98 to 10.05 and fall back. Consecutive parts are close to each other, so the moving ranges are small and Cpk looks healthy. The whole run, though, spreads much wider. Cpk describes what the process could do if its mean held still; Ppk describes what customers actually received. A gap this size means the next step is to find and remove the cause of the drift (tool wear, temperature, a material change), not to tighten the short-term variation.
Rough benchmarks for Cpk: below 1 not capable, 1 to 1.33 marginal, 1.33 or more capable, 1.67 for critical characteristics, 2 for six sigma. All of these assume a stable process with roughly normal output. For a skewed characteristic (flatness, runout) the ppm figures can be badly wrong.
Common mistakes
- Calculating Cpk from a process that is not in statistical control. Check a control chart first.
- Shuffling the measurements before pasting them. The moving-range σ needs production order.
- Reporting Cp alone. A process with Cp = 2 can still make scrap if it is off-centre; Cpk catches that.
- Drawing conclusions from 20 or 30 parts. Capability indices from small samples have wide confidence intervals; 50 to 100 measurements is a common minimum.
Common questions
What is a process capability index?
A ratio that compares the width of a specification with the natural spread of a process. Cp = (USL − LSL) ÷ 6σ asks whether the process could fit inside the limits; Cpk, the smaller of (USL − μ) ÷ 3σ and (μ − LSL) ÷ 3σ, also accounts for where the process is centred. Values above 1.33 are the usual target.
What is the difference between Cpk and Ppk?
Same formula, different σ. Cpk uses the within (short-term) σ, here estimated from the average moving range between consecutive measurements. Ppk uses the overall σ of all the data, which also includes shifts and drifts over time. If Ppk is much lower than Cpk, the process is not stable.
How is the within standard deviation calculated from individual measurements?
Take the absolute difference between each measurement and the one before it (the moving range), average those differences to get MR̄, and divide by d₂ = 1.128. This is the method used for an individuals control chart, and it is why the order of the measurements matters.
How do I convert Cpk to ppm defective or a sigma level?
3 × Cpk is the distance from the mean to the nearer limit in standard deviations. The normal tail area beyond that distance, times one million, is the ppm beyond that limit. The calculator adds both tails. Cpk = 1.33 means 4σ to the nearer limit and about 32 ppm on that side; Cpk = 2 is the six sigma level.
Can I use this with only one specification limit?
Yes. Leave the other limit blank. Cpk (and Ppk) then equal the one-sided index for the limit you gave, and Cp and Pp are not defined because there is no specification width.
Related calculators
-
Cpk calculator
Cp and Cpk from a mean, SD and limits, with the capability chart.
-
Normal distribution calculator
Tail areas behind the ppm figures.
-
Sample standard deviation calculator
The overall σ of a set of measurements.