Youden index calculator
Find Youden's J for a test, or the threshold that maximises it. Paste sensitivity and specificity at each cut-off, or switch to a single table of counts.
| Cut-off | Sensitivity | Specificity | Youden's J |
|---|---|---|---|
| 100 | 0.98 | 0.4 | 0.38 |
| 110 | 0.95 | 0.55 | 0.5 |
| 120 | 0.9 | 0.7 | 0.6 |
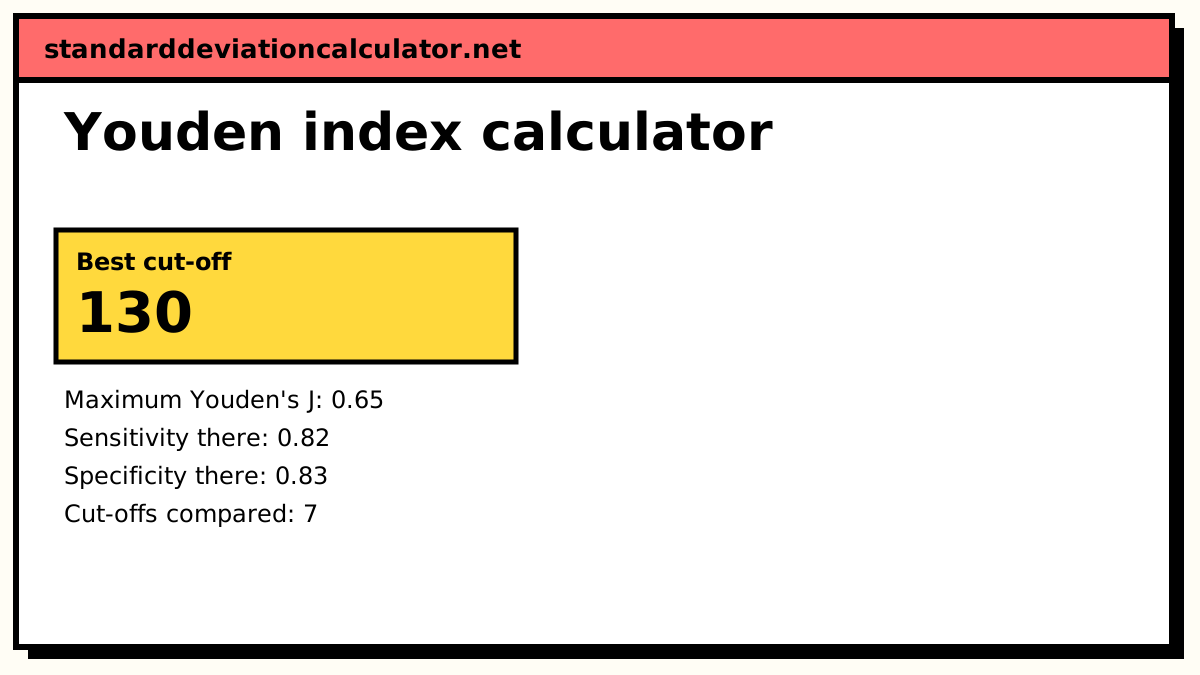
| 130 | 0.82 | 0.83 | 0.65 |
| 140 | 0.7 | 0.9 | 0.6 |
| 150 | 0.55 | 0.95 | 0.5 |
| 160 | 0.35 | 0.98 | 0.33 |
┄ Chance (J = 0) ━ ROC curve through your cut-offs
Show the working, step by step
Work out J = sensitivity + specificity − 1 at every cut-off.
100: 0.98 + 0.4 − 1 = 0.38 110: 0.95 + 0.55 − 1 = 0.5 120: 0.9 + 0.7 − 1 = 0.6 130: 0.82 + 0.83 − 1 = 0.65 140: 0.7 + 0.9 − 1 = 0.6 150: 0.55 + 0.95 − 1 = 0.5 160: 0.35 + 0.98 − 1 = 0.33
Pick the cut-off with the largest J. On the ROC plot it is the point furthest above the diagonal.
best = 130, J = 0.65
Youden’s J weights false positives and false negatives equally. If one kind of mistake is much worse, pick the cut-off on cost, not on J.
The formula
J = sensitivity + specificity − 1 = TP ÷ (TP + FN) + TN ÷ (TN + FP) − 1
Equivalently, J = sensitivity − false-positive rate: the gap between how often the test fires for people with the condition and for people without it.
Worked example: choosing a cut-off
The default table is a blood marker measured at seven thresholds from 100 to 160. As the threshold rises, fewer people test positive, so sensitivity falls and specificity rises.
| Cut-off | Sensitivity | Specificity | J |
|---|---|---|---|
| 100 | 0.98 | 0.40 | 0.38 |
| 110 | 0.95 | 0.55 | 0.50 |
| 120 | 0.90 | 0.70 | 0.60 |
| 130 | 0.82 | 0.83 | 0.65 |
| 140 | 0.70 | 0.90 | 0.60 |
| 150 | 0.55 | 0.95 | 0.50 |
| 160 | 0.35 | 0.98 | 0.33 |
J peaks at a cut-off of 130, where 0.82 + 0.83 − 1 = 0.65. On the ROC plot this is the point at (1 − 0.83, 0.82) = (0.17, 0.82), the one sitting highest above the diagonal.
Worked example: one table of counts
Switch to the table mode. With 82 true positives, 18 false negatives, 17 false positives and 83 true negatives, sensitivity is 82 ÷ 100 = 0.82 and specificity is 83 ÷ 100 = 0.83, so J = 0.65, the same test at the 130 cut-off.
How to interpret J
J measures how well a test separates the two groups at one threshold, regardless of prevalence. There is no universal scale, but a J near 0 means the test adds little, and values above about 0.5 are generally seen as a useful test. For a whole test across all thresholds, the area under the ROC curve is the usual summary; J describes a single operating point on that curve.
The optimal cut-off in your sample is itself an estimate. With a small study it can move a lot between samples, and J at the chosen point tends to be optimistic because the point was picked to maximise it. Validate the cut-off in a separate sample before relying on it.
Where the thresholds come from
Sensitivity and specificity at each threshold usually come from a study that measured the marker in people with and without the condition. For every candidate cut-off, count how many of the diseased group are at or above it (sensitivity) and how many of the non-diseased group are below it (specificity). Statistical packages list these pairs as the coordinates of the ROC curve, and you can paste them straight into the table here.
Include enough thresholds to see the peak clearly. If the largest J sits at the first or last row, the best cut-off may lie outside the range you tried.
Common mistakes
- Using the Youden cut-off when the costs of errors are very different. Weigh the consequences of misses and false alarms instead.
- Mixing decimal and percentage columns in a way that is ambiguous. A value of 1 is read as 1.0 (100%), not 1%.
- Reporting J without the sensitivity and specificity behind it. Many different pairs give the same J.
Common questions
What is Youden's index?
A single number summarising a diagnostic test: J = sensitivity + specificity − 1. It runs from 0 (the test is no better than chance) to 1 (perfect). W. J. Youden proposed it in 1950. It is also called Youden's J statistic or informedness.
How do I find the optimal cut-off with Youden’s J?
Work out sensitivity and specificity at each candidate threshold, compute J at each, and choose the threshold with the largest J. On an ROC curve that is the point furthest above the diagonal line of chance, measured vertically.
Can Youden’s J be negative?
Yes, down to −1. A negative J means the test gives positive results more often to people without the condition than to people with it, so it is working backwards. Flipping its interpretation would give a positive J.
Is the Youden cut-off always the best one to use?
Only if a false positive and a false negative cost about the same. J weights them equally. For a screening test where a missed case is serious, a lower cut-off with higher sensitivity is usually better, even though its J is smaller. The Youden point is a neutral starting place, not a clinical decision.
Can I enter sensitivity and specificity as percentages?
Yes. In the cut-off table, 82, 82% and 0.82 are all read as 82%. Any value above 1 is treated as a percentage.
Related calculators
-
Sensitivity and specificity
Sens, spec, PPV, NPV and LRs with confidence intervals.
-
Confusion matrix calculator
Every metric of a 2×2 table, including informedness.
-
Post-test probability
What a positive or negative result means for a patient.