ROI, CAGR and NPV calculator
Measure an investment three ways: total return (ROI), the steady yearly growth rate that links a start and end value (CAGR), and the net present value and IRR of a series of cash flows.
Show the working, step by step
CAGR = (ending ÷ starting)1/years − 1.
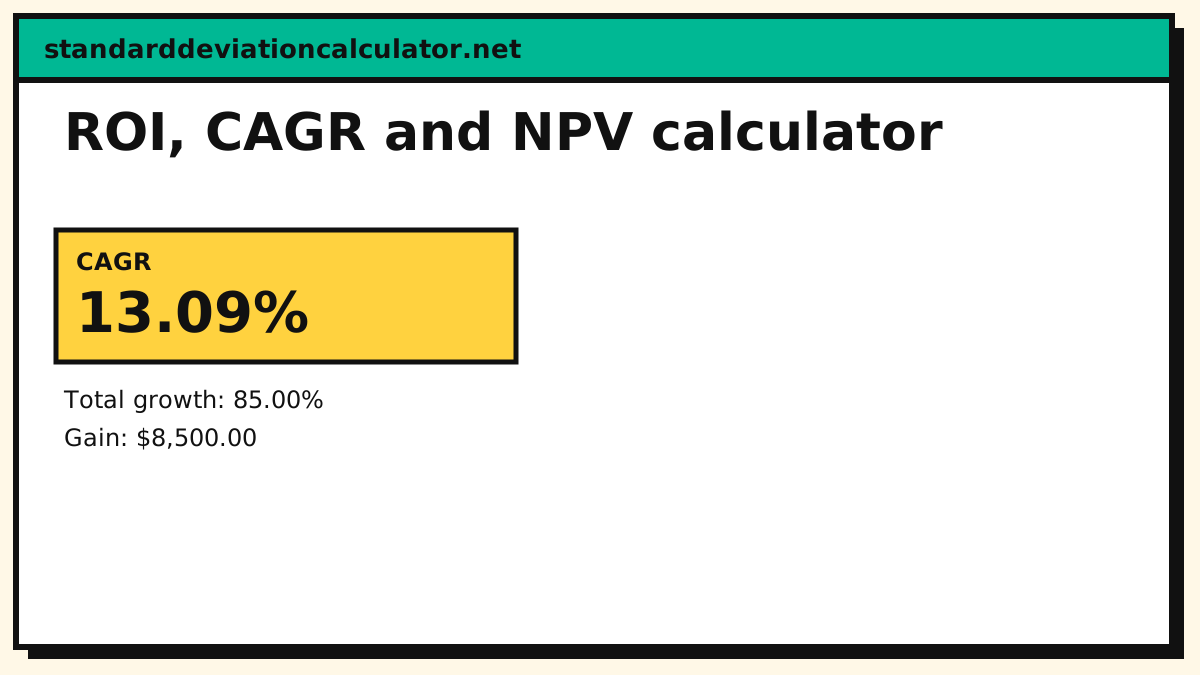
($18,500.00 ÷ $10,000.00)1/5 − 1 = 13.09%
Formulas
ROI = (end − start) ÷ start CAGR = (end ÷ start)^(1/years) − 1 NPV = Σ CF_t ÷ (1 + r)^t
A positive NPV means the project earns more than the discount rate you chose; the IRR is the rate at which the NPV is exactly zero.
How to use the ROI, CAGR and NPV calculator
Choose the calculation first. CAGR and ROI take a starting value (or amount invested), an ending value (or amount returned) and the number of years. NPV and IRR take a discount rate in percent and a list of cash flows separated by commas, with year 0 first and money you pay out written as a negative number, for example -10000, 3000, 4000, 4500, 3000. The result shows the headline figure with the working underneath, so you can check each step against your own spreadsheet.
Example: one investment, three answers
Suppose 10,000 grows to 18,500 over 5 years. The ROI is (18,500 − 10,000) ÷ 10,000 = 85%, the total gain. The CAGR is (18,500 ÷ 10,000)1/5 − 1 = 13.09% a year, the steady yearly rate that would produce the same ending value. The two numbers answer different questions: ROI says how much you made, CAGR says how fast it grew, and only CAGR lets you compare a 3-year investment with a 10-year one.
ROI: total return
Return on investment is the gain divided by what you put in. It ignores time, so 44% over one year and 44% over ten years look identical. Invest 5,000 and get back 7,200 and the ROI is (7,200 − 5,000) ÷ 5,000 = 44%. When you enter years the calculator also shows the annualised figure, which for 44% over 3 years is 12.92% a year. Remember that ROI depends on what you count as cost: fees, taxes and the time you spent all change it, so use the same definition when you compare projects.
CAGR: smoothing growth into one rate
Compound annual growth rate answers “what constant yearly return turns the start value into the end value?” Real returns bounce around, and CAGR hides that bounce on purpose. Two investments can share a 10.67% CAGR (100 growing to 150 over 4 years) and still have very different risk along the way. Because CAGR compounds, it is lower than the plain average of yearly returns whenever returns vary: a gain of 50% followed by a loss of 50% has an average of 0% but leaves you 25% down, a CAGR of about −13.4% a year over the two years.
NPV: what future cash is worth today
A pound received next year is worth less than a pound today, so net present value discounts every cash flow back to year 0 at your chosen rate and adds them up. Each cash flow is divided by (1 + rate) raised to its year. Take the flows −10,000, 3,000, 4,000, 4,500 and 3,000. At an 8% discount rate the NPV is 1,984; at 5% it is 2,841 and at 12% it is 977. The rule is simple: a positive NPV means the project earns more than your required rate and is worth doing, a negative NPV means it does not. NPV falls as the discount rate rises, because distant cash is shrunk more.
IRR: the break-even rate
The internal rate of return is the discount rate at which NPV is exactly zero. For the cash flows above it is about 16.48%, which is why the NPV at 12% is still positive and the NPV at 16.48% is almost nothing. If your required return is below the IRR, the project clears the hurdle. IRR can mislead when cash flows change sign more than once, because there may be several break-even rates, and it does not show scale: a small project can have a high IRR and a small NPV. When the two disagree, trust NPV.
Choosing a discount rate
The discount rate is your required return, and it is a judgement, not a fact. Common choices are the return you could earn on a similar-risk alternative, the cost of borrowing the money, or a company’s own hurdle rate. Riskier projects deserve a higher rate. Try several: if a project only works at a rate lower than any sensible alternative, it is marginal.
Rule of 72 and quick checks
A fast way to sanity-check a CAGR is the rule of 72: divide 72 by the annual rate in percent to estimate the years needed to double. At 13.09% a year, 72 ÷ 13.09 is about 5.5 years, which agrees with growing from 10,000 to 18,500 in 5 years. At 6% money doubles in about 12 years and at 9% in about 8. The rule is an approximation that works best between about 6% and 10%.
Worked comparison: two projects
Project A costs 10,000 and returns 3,000, 4,000, 4,500 and 3,000 over four years. Project B costs 10,000 and returns 12,500 in one lump sum after four years. Their ROI is 45% and 25% respectively, so A looks better. Now discount at 8%: A has an NPV of 1,984, while B is worth 12,500 ÷ 1.084 − 10,000 = −816. B does not even beat an 8% alternative, because its CAGR is only 5.7% a year. A gets money back sooner, and sooner money is worth more. This is the main reason to use NPV and CAGR instead of ROI alone.
Using the three measures together
Use ROI for a quick scoreboard on a finished investment, CAGR to compare growth across different lengths of time, and NPV or IRR when money moves in and out over the years. A savings plan with regular deposits, a rental property with yearly income and a business with staged spending all belong in NPV mode. A single purchase and a single sale belong in CAGR. If an answer looks too good, check the inputs first: one extra zero in the ending value changes everything.
Inflation and real returns
A nominal CAGR of 7% in a year with 3% inflation is a real return of about 3.9%, since (1.07 ÷ 1.03) − 1 = 3.88%. To work in real terms, either deflate your cash flows or subtract inflation from your discount rate before comparing. Long projects are very sensitive to this choice.
Frequently confused terms
Annualised return usually means the same thing as CAGR when the growth is compounded, while a simple annual return divides total ROI by the years (44% over 3 years is 14.7% simple, 12.9% compounded). Payback period is the time to recover the initial outlay and ignores everything after it. Hurdle rate is the minimum return a project must beat, and is what you enter as the discount rate.
Common mistakes and limits
- Comparing ROI across different time spans. Use CAGR or the annualised figure instead.
- Mixing up the sign of cash flows. Money you spend is negative and money you receive is positive; flip one and the NPV is meaningless.
- Forgetting inflation, fees and tax. All three lower the real return, and this calculator does not apply any of them.
- Treating a past CAGR as a forecast. It describes what happened, not what will happen.
- Using years that do not match your flows. The NPV mode assumes one cash flow per year, evenly spaced.
This is an arithmetic tool for comparing numbers, not financial advice.
Common questions
What is a good CAGR?
It depends on the asset and risk: long-run broad stock-market returns have been in the high single digits a year, but past returns do not guarantee future ones.
What is the difference between ROI and CAGR?
ROI is the total gain over the whole period; CAGR converts it into a steady yearly rate so investments of different lengths compare fairly.
How do I enter cash flows for NPV?
List them in order starting with year 0, with money you spend as negative and money you receive as positive.
What is a good CAGR?
There is no universal answer, because it depends on risk and the period. Compare a CAGR with the return of a realistic alternative over the same years and with inflation, and treat a figure that is far above both with suspicion.
Can CAGR be negative?
Yes. If the ending value is lower than the start, the base of the root is below 1 and the CAGR is negative. For example 10,000 falling to 8,000 over 4 years is about −5.4% a year.
What is the difference between ROI and CAGR?
ROI is the total percentage gain over the whole period, while CAGR is the equivalent steady yearly rate. A 100% ROI over 10 years is a CAGR of about 7.2%, over 2 years about 41.4%.
Why is my NPV negative?
The discounted inflows are smaller than the outflows at your chosen rate. Try a lower rate, or check whether the first cash flow, the investment, is entered as a negative number.
Is NPV better than IRR?
NPV is the safer guide because it shows the value created in money and has no multiple-answer problem. IRR is handy as a single rate to compare with your required return.
Does the calculator include inflation or tax?
No. Enter figures that already include whatever costs matter, or adjust the rate for inflation yourself.
Related calculators
-
Compound interest
Growth from a rate.
-
Finance calculator (TVM)
PV, FV, PMT.
-
Loan calculator
Cost of borrowing.
-
Standard deviation in finance
Risk of a return.