Standard deviation of the sample mean calculator
Work out how much a sample average moves from sample to sample. Enter a standard deviation and a sample size, or paste the data, and the calculator divides by √n. It applies the finite population correction when you give a population size.
Applies the finite population correction √((N − n)/(N − 1)).
┄ Individual values: SD σ = 15 ━ Sample means (n = 25): SD σ/√n = 3
| Sample size | σ ÷ √n | Compared with n = 25 |
|---|---|---|
| 25 | 3 | – |
| 100 | 1.5 | 2× smaller |
| 400 | 0.75 | 4× smaller |
| 2500 | 0.3 | 10× smaller |
Show the working, step by step
Divide the standard deviation by the square root of the sample size.
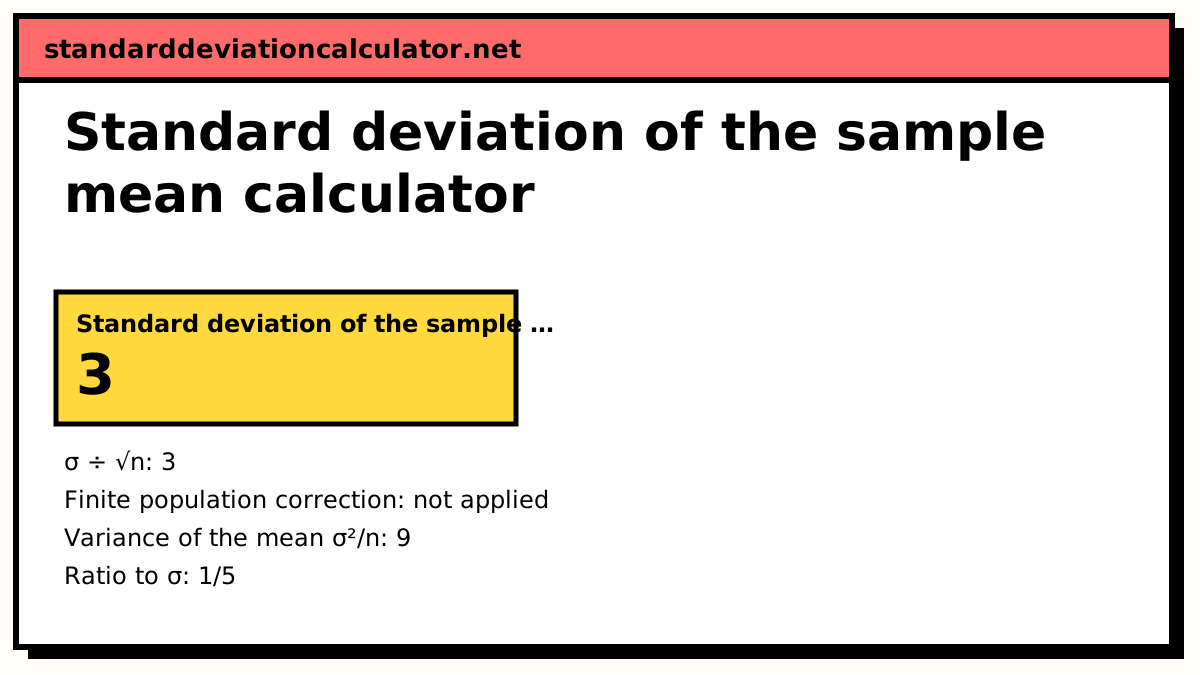
σx̄ = σ ÷ √n = 15 ÷ √25 = 15 ÷ 5 = 3
This quantity is also called the standard error of the mean. With a sample SD s in place of σ it is an estimate, and intervals built from it use the t distribution.
The formula
σx̄ = σ ÷ √n σx̄ = (σ ÷ √n) × √((N − n) ÷ (N − 1)) (finite population of size N)
σ is the standard deviation of individual values in the population, n is the sample size and N the population size. If σ is unknown, the sample standard deviation s takes its place, and the result is an estimate of σx̄.
A worked example from σ
The default: an IQ-style test has a standard deviation of 15 points, and you average the scores of 25 people chosen at random.
σx̄ = 15 ÷ √25 = 15 ÷ 5 = 3
Individual scores spread with a standard deviation of 15, but the average of 25 scores spreads with a standard deviation of only 3, a fifth as much. Averages of 25 people will usually land within about 6 points (two standard deviations) of the population mean, while single people often land 30 points away.
Grow the sample and the spread of the mean keeps falling, but slowly:
| Sample size n | σ ÷ √n |
|---|---|
| 25 | 3 |
| 100 | 1.5 |
| 400 | 0.75 |
| 2,500 | 0.3 |
Each fourfold increase in n halves the result.
A worked example from data
Switch the input to sample data and use the default values 12, 15, 9, 14, 11, 13, 16, 10. The mean is 12.5. The squared deviations sum to 42, so the sample standard deviation is s = √(42 ÷ 7) = √6 = 2.44949. With n = 8:
sx̄ = 2.44949 ÷ √8 = 2.44949 ÷ 2.82843 = 0.866025
Because s is itself estimated from the data, intervals built from this value use the t distribution with n − 1 = 7 degrees of freedom rather than z.
The finite population correction
σ/√n assumes the population is so large that removing sampled items doesn't change it. When you sample a large share of a small population without replacement, the mean varies less than that. Go back to σ = 15 and n = 25, and suppose the population has only N = 100 people:
FPC = √((100 − 25) ÷ 99) = 0.870388 σx̄ = 3 × 0.870388 = 2.61116
If you sampled all 100, the correction would be 0 and so would the spread: there is nothing left to vary. Below a 5% sampling fraction the factor is above 0.975 and is usually ignored.
Common mistakes
- Reporting σ/√n as though it described individual values. It describes the average, not a single observation.
- Dividing by n instead of √n. With σ = 15 and n = 25 that gives 0.6 instead of 3.
- Using the population formula (dividing by n) for s when working from data. The sample SD divides by n − 1.
- Applying the finite population correction when sampling with replacement, or when N is not really fixed.
Common questions
What is the standard deviation of the sample mean?
It measures how much the average of a sample would vary if you drew many samples of the same size. It is written σx̄ and equals σ/√n, where σ is the standard deviation of the individual values and n the sample size. It is always smaller than σ, because averaging cancels out some of the variation.
Is it the same as the standard error of the mean?
Yes. "Standard error of the mean" is the more common name. Strictly, σ/√n is the true value when σ is known, and s/√n is its estimate from a sample. Most people call both the standard error.
When do I need the finite population correction?
When you sample without replacement and the sample is more than about 5% of the population. Then multiply σ/√n by √((N − n)/(N − 1)). With σ = 15, n = 25 and a population of N = 100, the factor is 0.870388 and the standard deviation of the mean drops from 3 to 2.61116.
Why does it shrink with √n and not with n?
The variance of a sum of n independent values is n σ², so the variance of their mean is n σ² / n² = σ²/n. Taking the square root gives σ/√n. That is why a sample four times larger only halves the spread of the mean.
Related calculators
-
Standard error calculator
Standard errors for means, proportions and differences.
-
Central limit theorem
Use σ/√n to find the probability that x̄ lands in a range.
-
Confidence interval
Turn the standard error into an interval for the mean.