Point estimate calculator
Enter the number of successes and trials to get four point estimates of the true proportion and the one a common rule of thumb recommends. Or enter the two ends of a confidence interval to recover the estimate and the margin of error.
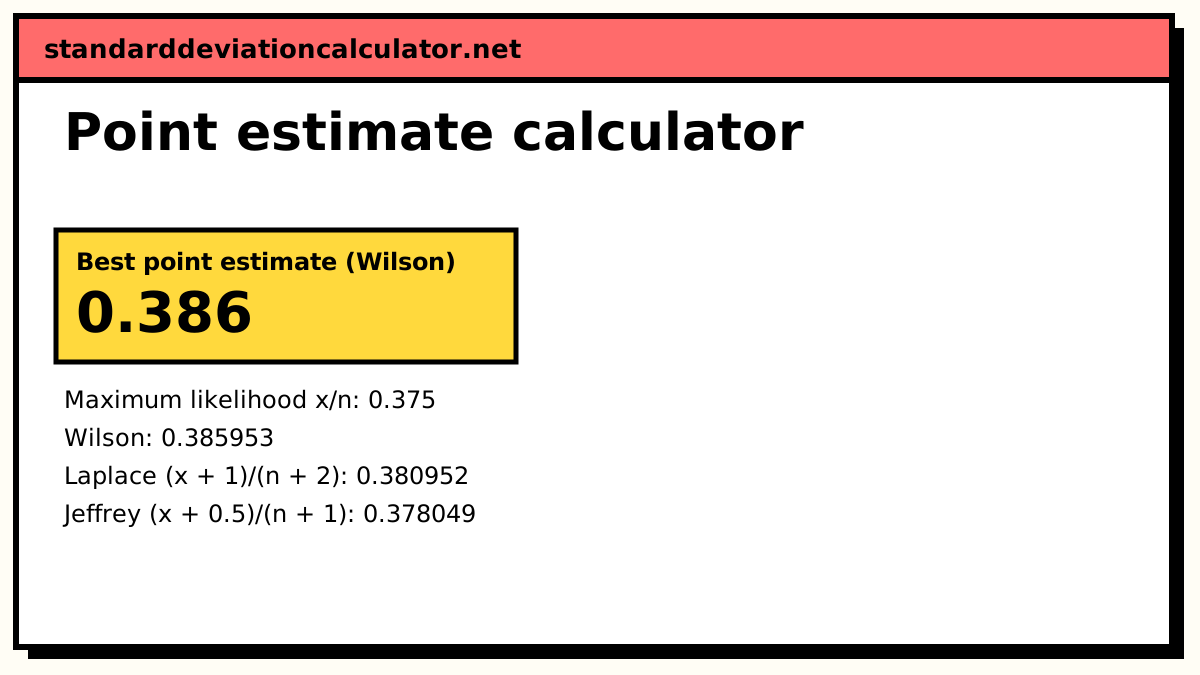
| Method | Formula | Estimate | As % |
|---|---|---|---|
| Maximum likelihood (MLE) | x ÷ n | 0.375 | 37.5% |
| Wilson | (x + z²/2) ÷ (n + z²) | 0.385953 | 38.6% |
| Laplace | (x + 1) ÷ (n + 2) | 0.380952 | 38.1% |
| Jeffrey | (x + 0.5) ÷ (n + 1) | 0.378049 | 37.8% |
Show the working, step by step
Maximum likelihood: the observed proportion.
MLE = 15 ÷ 40 = 0.375
Laplace adds one success and one failure.
(15 + 1) ÷ (40 + 2) = 16 ÷ 42 = 0.380952
Jeffrey adds half a success and half a failure.
(15 + 0.5) ÷ (40 + 1) = 15.5 ÷ 41 = 0.378049
Wilson adds z²/2 successes and z²/2 failures, with z = 1.95996 for 95% confidence.
z² = 3.84146 (15 + 1.92073) ÷ (40 + 3.84146) = 16.9207 ÷ 43.8415 = 0.385953
Choose by the rule of thumb.
The MLE 0.375 is at most 0.5, so the Wilson estimate is used.
The Wilson estimate is the centre of the Wilson score interval. All four pull the estimate towards 0.5; the pull shrinks as n grows, and for large n the four agree.
The formulas
With x successes in n trials and z the critical value for your confidence level:
MLE = x ÷ n Laplace = (x + 1) ÷ (n + 2) Jeffrey = (x + 0.5) ÷ (n + 1) Wilson = (x + z²/2) ÷ (n + z²)
The maximum likelihood estimate (MLE) is the observed proportion. The other three each add a small number of imaginary successes and failures before dividing. Laplace adds one of each, Jeffrey adds half of each, and Wilson adds z²/2 of each, which at 95% confidence is about 1.92. That is why they are sometimes called shrinkage estimates: they shrink x/n towards 0.5.
A worked example
The default: 15 successes in 40 trials, with 95% confidence (z = 1.95996, so z² = 3.84146).
MLE = 15 ÷ 40 = 0.375 Laplace = 16 ÷ 42 = 0.380952 Jeffrey = 15.5 ÷ 41 = 0.378049 Wilson = (15 + 1.92073) ÷ (40 + 3.84146) = 16.9207 ÷ 43.8415 = 0.385953
The MLE is 0.375, which is at most 0.5, so the rule of thumb picks Wilson: about 0.386, or 38.6%. All four estimates sit between 37.5% and 38.6%, a spread of about one percentage point. That spread is small next to the sampling uncertainty with only 40 trials, where a 95% interval is roughly ±15 points wide.
For a contrast, try 45 successes in 50 trials. The MLE is 0.9, so the rule uses the smaller of Jeffrey (0.892157) and Laplace (0.884615), giving 0.8846. With 30 of 50 the MLE of 0.6 falls in the middle band and is used as it is.
The rule for choosing
The calculator applies a rule of thumb that circulates in textbooks and online calculators: Wilson when x/n ≤ 0.5, the MLE when 0.5 < x/n < 0.9, and the smaller of Jeffrey and Laplace when x/n ≥ 0.9. Treat this as a convention, not a law. The estimators trade a little bias for less variance, and which trade is better depends on the true p and on the loss you care about. If your field has a standard (for example, reporting x/n with a Wilson interval), follow it.
From a confidence interval
Switch the input to a confidence interval when a report gives only the bounds. For a symmetric interval the point estimate is the midpoint and the margin of error is half the width. The default interval 42.1 to 47.9 gives an estimate of (42.1 + 47.9) ÷ 2 = 45 and a margin of (47.9 − 42.1) ÷ 2 = 2.9, so the interval reads 45 ± 2.9.
How to interpret the result
A point estimate is your single best guess, and it will almost never equal the true value exactly. Always report it with some measure of uncertainty: a standard error, a margin of error or a confidence interval. When the four estimates here disagree noticeably, that is itself a signal: the sample is small or the result is near 0 or 1, and the interval matters more than the point.
Common mistakes
- Taking the midpoint of an asymmetric interval. The Wilson and exact intervals for a proportion are not centred on x/n.
- Entering a percentage as x. x is a count of successes, a whole number no bigger than n.
- Reporting 0% or 100% from a small sample. With 0 successes in 12, the MLE is 0 but Laplace gives 1/14 ≈ 0.071, which is a more honest summary.
- Treating the choice of estimator as more important than the sample size. Doubling n narrows the uncertainty far more than switching formulas.
Common questions
What is a point estimate?
A single number used as the best guess for an unknown population value. The sample mean x̄ is the point estimate of μ, and the sample proportion x/n is the usual point estimate of a population proportion p. A confidence interval adds a range around that guess to show how uncertain it is.
Which point estimate of a proportion is best?
There is no single best one for every case. A common rule of thumb picks Wilson when the observed proportion x/n is at most 0.5, the plain maximum likelihood estimate between 0.5 and 0.9, and the smaller of the Jeffrey and Laplace estimates from 0.9 up. The calculator follows that rule, but it is a convention for small samples, not a theorem. With a large sample the four estimates are nearly identical and the choice stops mattering.
Why not always use x/n?
x/n is unbiased and is the maximum likelihood estimate, so it is a sound default. Its weak spot is small samples with extreme results. If 0 of 12 tested items fail, x/n says the failure rate is exactly 0, which nobody believes. Laplace, Jeffrey and Wilson all add a few imaginary observations that pull the estimate away from 0 and 1.
How do I find the point estimate from a confidence interval?
For an interval of the form estimate ± margin, take the midpoint: (lower + upper) ÷ 2. The margin of error is half the width. For the interval 42.1 to 47.9 the estimate is 45 and the margin is 2.9. This does not work for asymmetric intervals such as the Wilson or exact (Clopper–Pearson) interval for a proportion.
Does the confidence level change the point estimate?
Only for the Wilson estimate, which depends on z. Raising the confidence level raises z and pulls the Wilson estimate further towards 0.5. The MLE, Laplace and Jeffrey estimates ignore the confidence level.
Related calculators
-
Confidence interval calculator
Put a range around the point estimate of a mean.
-
Sampling distribution of p̂
How much a sample proportion varies from sample to sample.
-
Sampling error calculator
The ± margin that goes with a survey proportion.