Sampling error calculator
Find the ± margin of sampling error for a poll or survey result. Enter the proportion (or a standard deviation for a mean), the sample size and a confidence level; add the population size if you sampled a large share of it.
Use 0.5 (50%) for the most cautious, worst-case margin.
Only matters when the sample is more than about 5% of the population.
| Sample size n | Margin at 95% |
|---|---|
| 100 | ±9.8 percentage points |
| 250 | ±6.198 percentage points |
| 500 | ±4.383 percentage points |
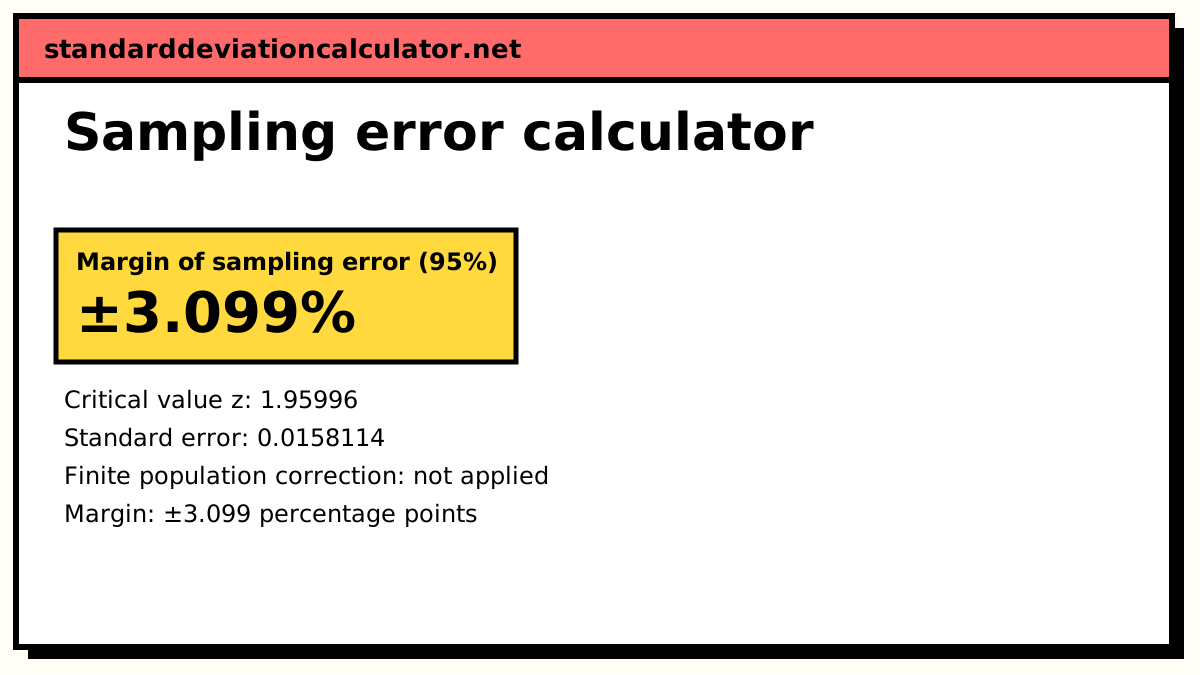
| 1000 | ±3.099 percentage points |
| 1500 | ±2.53 percentage points |
| 2500 | ±1.96 percentage points |
| 5000 | ±1.386 percentage points |
Show the working, step by step
Critical value for 95% confidence.
z = 1.95996
Standard error of the estimate.
SE = √(p̂(1 − p̂) ÷ n) = √(0.5 × 0.5 ÷ 1000) = 0.0158114
Multiply.
E = z × SE = 1.95996 × 0.0158114 = 0.0309898 (3.099 percentage points)
This is random sampling error only. It does not cover bias from who was sampled, who answered or how the question was worded.
The formula
Proportion: E = z × √(p̂(1 − p̂) ÷ n) × FPC Mean: E = z × σ ÷ √n × FPC FPC = √((N − n) ÷ (N − 1))
z is the critical value for the confidence level: 1.645 at 90%, 1.960 at 95% and 2.576 at 99%. Leave the population size blank and the finite population correction (FPC) is 1, which is right for any population much larger than the sample.
A worked example
The default is a poll of 1,000 people, with p̂ = 0.5 and 95% confidence.
SE = √(0.5 × 0.5 ÷ 1000) = 0.0158114 E = 1.95996 × 0.0158114 = 0.0309898
The margin of sampling error is ±3.099 percentage points, so a reported 50% means the population figure is likely between 46.9% and 53.1%. At 90% confidence the same sample gives ±2.60 points, and at 99% it gives ±4.07.
Now suppose the 1,000 people were drawn from a membership list of only 5,000. The sample is 20% of the population, so the correction matters:
FPC = √((5000 − 1000) ÷ (5000 − 1)) = 0.894517 E = 0.0309898 × 0.894517 = ±2.772 points
For a mean, switch the statistic. With σ = 12 and n = 1,000 the margin is 1.95996 × 12 ÷ √1000 = ±0.744 in the units of the data.
How sample size drives the margin
The margin falls with the square root of n, so gains get expensive quickly. At p̂ = 0.5 and 95% confidence:
| Sample size | Margin |
|---|---|
| 100 | ±9.80 points |
| 400 | ±4.90 points |
| 1,000 | ±3.10 points |
| 1,500 | ±2.53 points |
| 2,500 | ±1.96 points |
Going from 100 to 400 people halves the margin; halving it again needs 1,600. This is why most national polls settle between 1,000 and 1,500 respondents.
How to read the result
A 95% margin means that if the survey were repeated many times with fresh random samples, about 95% of the intervals p̂ ± E would contain the true population value. It is not a guarantee about this one survey, and it applies to the whole sample. A subgroup, such as respondents under 30, has its own smaller n and a wider margin. The difference between two candidates in the same poll also has a larger margin than either share alone, close to double when the race is tight.
The margin also assumes a simple random sample. Weighting and cluster sampling usually inflate the variance; survey reports adjust for this with a design effect, which multiplies the effective margin by its square root.
Common mistakes
- Treating the margin as the total error. It covers random sampling only; coverage, non-response and wording bias come on top.
- Applying the full-sample margin to a subgroup of 150 people. Recalculate with that subgroup's n.
- Entering 50 instead of 0.5 or 50%. The calculator reads 50% as a percentage, but a bare 50 is not a proportion.
- Applying the finite population correction when N is huge, or skipping it when you surveyed a large share of a small group.
- Reading a 2-point lead with a ±3-point margin as a clear win. It is within the noise.
Common questions
What is sampling error?
The difference between a result from a sample and the value you would get by measuring the whole population, caused only by chance in which members ended up in the sample. It is unavoidable whenever you sample, and it shrinks as the sample grows. The margin of sampling error is the ± figure that covers it at a chosen confidence level.
Why do polls of 1,000 people report ±3%?
Because z × √(0.5 × 0.5 ÷ 1000) at 95% confidence is 1.96 × 0.0158 = 0.031, or 3.1 percentage points. Pollsters use p = 0.5 because it gives the largest margin, so the quoted figure is safe for every question in the survey. A result of 20% or 80% from the same sample has a smaller margin, about 2.5 points.
Does the population size matter?
Hardly, unless the sample is a noticeable share of it. A sample of 1,000 has almost the same margin whether it comes from a city of 100,000 or a country of 300 million. The finite population correction √((N − n)/(N − 1)) only makes a real difference once n is more than about 5% of N. For 1,000 people out of 5,000 it cuts the margin from 3.10 to 2.77 points.
Is sampling error the same as margin of error?
The margin of error is the usual way to express sampling error: a half-width that covers the chance variation at a given confidence level. This page is aimed at survey work (proportions, population size, non-sampling error). For a margin of error on a mean from raw data, with the t distribution, use the margin of error calculator.
What does the margin of sampling error leave out?
Everything that is not random chance: a sampling frame that misses people, low response rates, people who answer differently from those who refuse, leading question wording, and data entry mistakes. These non-sampling errors do not shrink with a bigger sample and are often larger than the reported margin.
Related calculators
-
Margin of error calculator
Margin of error for a mean from raw data or summary statistics.
-
Sample size calculator
Work backwards from the margin you want to the sample you need.
-
Sampling distribution of p̂
The distribution behind the ± figure on a survey proportion.