Upper control limit calculator
Work out the upper and lower control limits for the common Shewhart charts. Paste your subgroups, measurements or defect counts, or enter the summary values, and the calculator gives the limits, draws the chart and flags any point outside them.
Every line must have the same number of values (2 to 25).
| Chart | LCL | Centre line | UCL |
|---|---|---|---|
| X̄ | 9.8208 | 10.03 | 10.239 |
| R | 0 | 0.3625 | 0.76632 |
┄ UCL ┄ Centre line ┄ LCL ━ Subgroup mean
┄ UCL ┄ Centre line ┄ LCL ━ Range
Show the working, step by step
Mean and range of each of the 8 subgroups, then average them.
x̿ = 10.03, R̄ = 0.3625
X̄ chart limits with A₂ = 0.577 for n = 5:
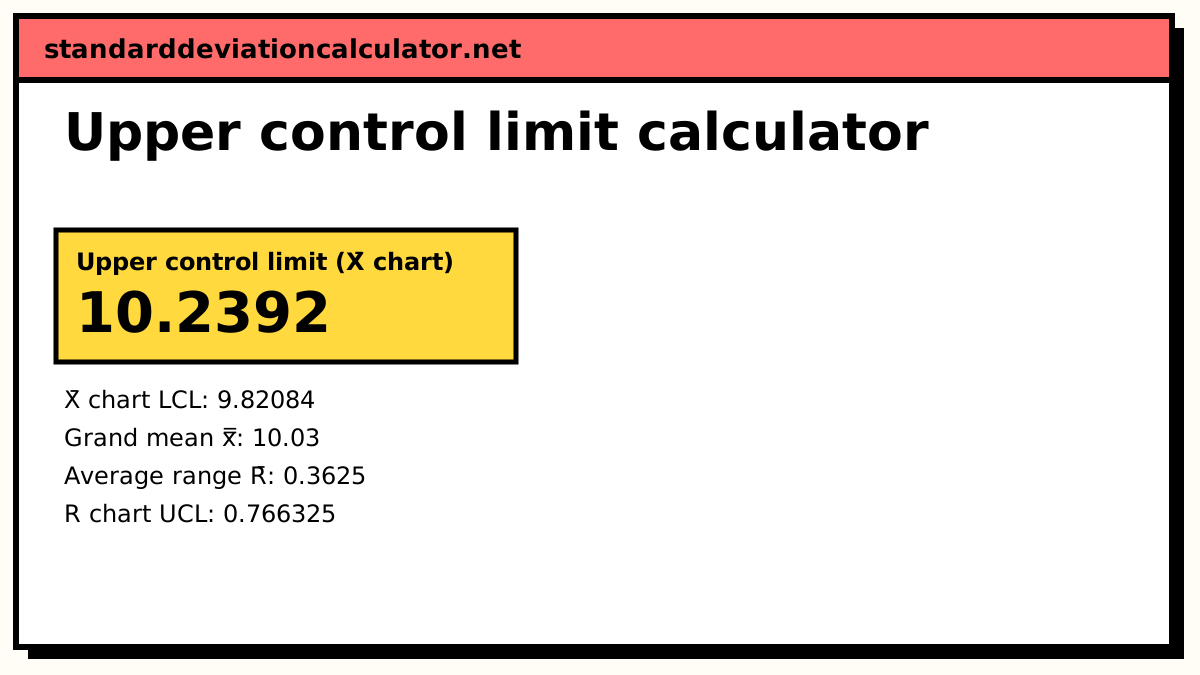
UCL = x̿ + A₂R̄ = 10.03 + 0.577 × 0.3625 = 10.2392 LCL = x̿ − A₂R̄ = 9.82084
R chart limits with D₃ = 0, D₄ = 2.114:
UCL = D₄R̄ = 2.114 × 0.3625 = 0.766325 LCL = D₃R̄ = 0
Read the R chart first: if the spread is out of control, the X̄ limits (which are built from R̄) are not trustworthy.
The formulas
Every Shewhart chart puts its limits three standard errors either side of the centre line. The charts differ in how they estimate that standard error.
X̄-R chart: UCL = x̿ + A₂R̄, LCL = x̿ − A₂R̄; R chart: UCL = D₄R̄, LCL = D₃R̄ X̄-s chart: UCL = x̿ + A₃s̄, LCL = x̿ − A₃s̄; s chart: UCL = B₄s̄, LCL = B₃s̄ I-MR chart: UCL = x̄ + 2.66 MR̄, LCL = x̄ − 2.66 MR̄; MR chart: UCL = 3.267 MR̄ p chart: UCL = p̄ + 3√(p̄(1 − p̄)/n), LCL = p̄ − 3√(p̄(1 − p̄)/n) c chart: UCL = c̄ + 3√c̄, LCL = c̄ − 3√c̄
The constants depend on the subgroup size n. They convert the average range or standard deviation into an estimate of σ and then into three standard errors of the mean.
| n | A₂ | D₃ | D₄ | A₃ | B₃ | B₄ |
|---|---|---|---|---|---|---|
| 2 | 1.880 | 0 | 3.267 | 2.659 | 0 | 3.267 |
| 3 | 1.023 | 0 | 2.574 | 1.954 | 0 | 2.568 |
| 4 | 0.729 | 0 | 2.282 | 1.628 | 0 | 2.266 |
| 5 | 0.577 | 0 | 2.114 | 1.427 | 0 | 2.089 |
| 6 | 0.483 | 0 | 2.004 | 1.287 | 0.030 | 1.970 |
| 8 | 0.373 | 0.136 | 1.864 | 1.099 | 0.185 | 1.815 |
| 10 | 0.308 | 0.223 | 1.777 | 0.975 | 0.284 | 1.716 |
The calculator holds the full table for subgroups of 2 to 25.
A worked example
The default data is eight subgroups of five measurements of a part's length. The subgroup means are 10.00, 10.10, 9.96, 10.20, 9.90, 10.04, 10.00 and 10.04, and the ranges are 0.4, 0.4, 0.3, 0.4, 0.4, 0.3, 0.4 and 0.3.
x̿ = 80.24 ÷ 8 = 10.03 R̄ = 2.9 ÷ 8 = 0.3625 UCL = 10.03 + 0.577 × 0.3625 = 10.2392 LCL = 10.03 − 0.577 × 0.3625 = 9.82084
For the range chart, D₄ = 2.114 and D₃ = 0, so its UCL is 2.114 × 0.3625 = 0.766325 and its LCL is 0. The highest subgroup mean, 10.20, sits just under the UCL of 10.2392, and the lowest, 9.90, is above the LCL, so no point signals a special cause.
Choosing the chart
Use X̄-R when you measure small subgroups (up to about 8 items) of a continuous quantity. Use X̄-s for larger subgroups, where the standard deviation uses the data more efficiently than the range. Use I-MR when each subgroup is a single measurement, such as one batch per day. Use a p chart for the proportion of defective items in samples, which may vary in size, and a c chart for the number of defects on a unit of fixed size.
With the default p-chart data (ten samples of 100 with 50 defectives in all), p̄ = 0.05 and the UCL is 0.05 + 3√(0.05 × 0.95 ÷ 100) = 0.1154. The default c-chart data averages four defects per unit, giving a UCL of 4 + 3 × 2 = 10.
Common mistakes
- Using the overall standard deviation of all the data instead of R̄ or s̄. That inflates the limits whenever the process shifts between subgroups, which hides the very shifts the chart is meant to catch.
- Reading the X̄ chart before the R or s chart. The X̄ limits are built from the spread, so an unstable spread makes them meaningless.
- Setting control limits from specification limits. They answer different questions.
- Recalculating the limits every time a new point arrives, which lets a drifting process pull its own limits along with it.
Common questions
What is an upper control limit?
The upper control limit (UCL) is the line on a control chart three standard errors above the centre line. A stable process almost never produces a point above it by chance (about 0.13% of the time for normal data), so a point beyond it signals a special cause worth investigating.
How do I calculate the UCL for an X̄-R chart?
UCL = x̿ + A₂R̄, where x̿ is the mean of the subgroup means, R̄ the average range and A₂ a constant for the subgroup size. With five items per subgroup A₂ = 0.577, so for x̿ = 10.03 and R̄ = 0.3625 the UCL is 10.03 + 0.577 × 0.3625 = 10.2392.
Are control limits the same as specification limits?
No. Control limits come from the process data and describe what the process actually does. Specification limits come from the customer or the design and describe what it should do. A process can be in control and still make parts out of specification. To compare the two, use a Cpk calculator.
Why is the lower control limit zero?
Ranges, standard deviations, proportions and counts cannot be negative. When the formula gives a negative lower limit, it is set to zero. For subgroups of six or fewer, D₃ is 0, so the R chart has no lower limit.
How many subgroups do I need?
Aim for 20 to 25 subgroups before treating the limits as final. With fewer, the limits are rough estimates and should be recalculated as data comes in. The default example uses eight subgroups only to keep it short.
Related calculators
-
Cpk calculator
Compare the process spread with its specification limits.
-
Standard deviation of the sample mean
Why subgroup means vary less than single values.
-
Mean and standard deviation
Summarise a set of measurements first.