Benford's law calculator
Check whether the leading digits of a dataset follow Benford's law. Paste the numbers, and the calculator counts the first digits, compares them with the expected shares and rates the fit.
Paste values separated by commas, spaces or new lines. Zeros are ignored; signs and decimal points do not matter.
Bars: the observed share of each first digit. Line and dots: Benford’s expected share, log₁₀(1 + 1/d).
| Digit | Count | Observed | Benford | Difference | z |
|---|---|---|---|---|---|
| 1 | 41 | 27.33% | 30.1% | −2.77 pts | 0.651 |
| 2 | 26 | 17.33% | 17.61% | −0.276 pts | 0.0887 |
| 3 | 20 | 13.33% | 12.49% | 0.839 pts | 0.187 |
| 4 | 16 | 10.67% | 9.691% | 0.976 pts | 0.266 |
| 5 | 14 | 9.333% | 7.918% | 1.42 pts | 0.491 |
| 6 | 9 | 6% | 6.695% | −0.695 pts | 0.177 |
| 7 | 10 | 6.667% | 5.799% | 0.867 pts | 0.28 |
| 8 | 8 | 5.333% | 5.115% | 0.218 pts | 0.121 |
| 9 | 6 | 4% | 4.576% | −0.576 pts | 0.142 |
| Total | 150 | 100% | 100% |
Show the working, step by step
Take the first non-zero digit of each number and count how many start with 1, 2, … 9.
n = 150; counts = 41, 26, 20, 16, 14, 9, 10, 8, 6
Benford’s law gives the expected share of each first digit.
P(d) = log₁₀(1 + 1/d): 30.1%, 17.6%, 12.5%, 9.7%, 7.9%, 6.7%, 5.8%, 5.1%, 4.6%
Mean absolute deviation: the average gap between observed and expected shares over the nine digits.
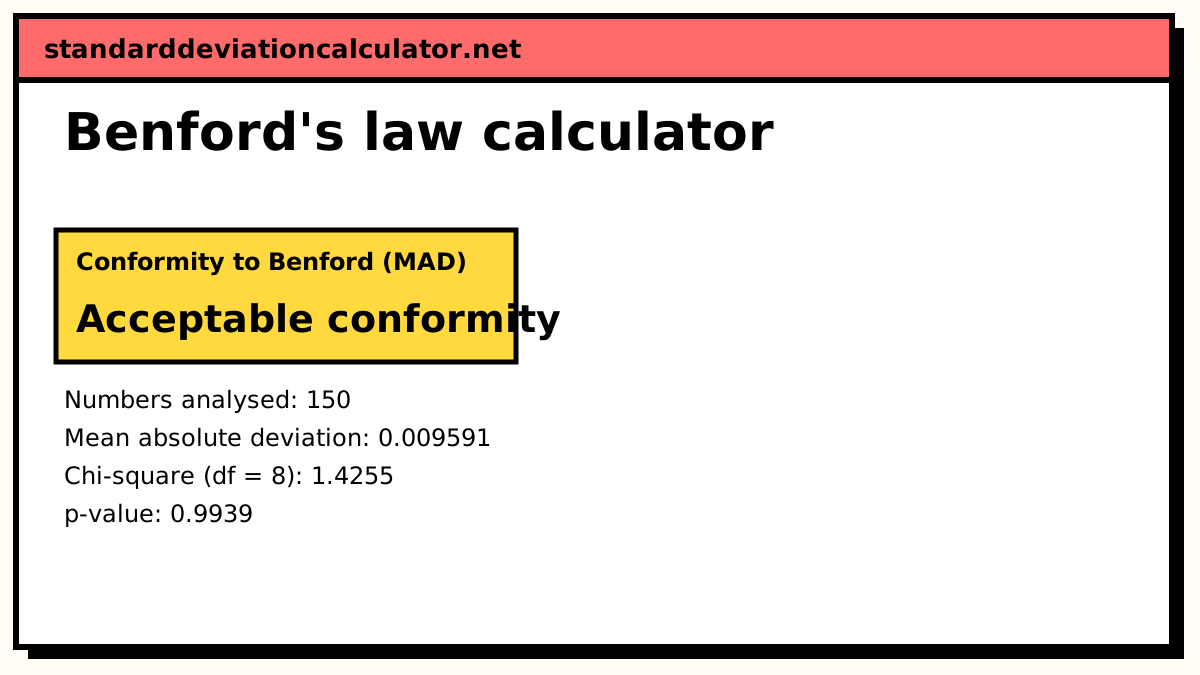
MAD = Σ|observed − expected| ÷ 9 = 0.00959086 Acceptable conformity (Nigrini: ≤ 0.006 close, ≤ 0.012 acceptable, ≤ 0.015 marginal, above that nonconformity)
Chi-square goodness of fit against the Benford counts n × P(d).
χ² = Σ(O − E)² ÷ E = 1.42546 with 8 degrees of freedom, p = 0.9939
With thousands of values the chi-square test flags even trivial departures, which is why forensic accountants lean on the MAD instead. Neither test proves fraud: they point to where to look.
The formula
P(d) = log₁₀(1 + 1/d), d = 1, 2, …, 9
The first digit is the first non-zero digit, so 0.0042 counts as 4 and −731 counts as 7. Zeros have no leading digit and are skipped.
| First digit | Expected share | Expected count in 150 |
|---|---|---|
| 1 | 30.1% | 45.15 |
| 2 | 17.6% | 26.41 |
| 3 | 12.5% | 18.74 |
| 4 | 9.7% | 14.54 |
| 5 | 7.9% | 11.88 |
| 6 | 6.7% | 10.04 |
| 7 | 5.8% | 8.70 |
| 8 | 5.1% | 7.67 |
| 9 | 4.6% | 6.86 |
Two measures of fit are reported. The mean absolute deviation averages the gaps between the observed and expected shares:
MAD = Σ |observed share − expected share| ÷ 9
The chi-square statistic compares counts, with 8 degrees of freedom:
χ² = Σ (O − E)² ÷ E
A worked example
The default data is 150 example amounts spread across three orders of magnitude, from about 10 to 9,000. They are illustration data, not real records. Their first digits split as 41, 26, 20, 16, 14, 9, 10, 8 and 6 for the digits 1 to 9.
So 41 of 150 values, or 27.33%, start with 1, against an expected 30.1%. The other digits are within a percentage point or two of their Benford shares. Averaging the nine absolute gaps gives
MAD = 0.009591
which falls in Nigrini's "acceptable conformity" band. The chi-square statistic is 1.4255 with 8 degrees of freedom, far below the 5% critical value of 15.507, and the p-value is 0.9939. Both measures say the example data is consistent with Benford's law.
Interpreting the MAD
Nigrini's thresholds for the first-digit test are:
| MAD | Conclusion |
|---|---|
| 0 to 0.006 | Close conformity |
| 0.006 to 0.012 | Acceptable conformity |
| 0.012 to 0.015 | Marginally acceptable conformity |
| above 0.015 | Nonconformity |
When the data does not conform, look at the digit table. A z-score above 1.96 marks a digit whose share differs from Benford at the 5% level. A spike at one digit often points to a specific cause, such as many payments just under an approval limit that starts with that digit. Then examine the records behind the spike.
Why the pattern appears
Think of a value that grows by a steady percentage, such as an account earning interest. It takes a 100% rise to go from 1,000 to 2,000, so the value spends a long time with a leading 1. Going from 9,000 to 10,000 takes only an 11% rise, so a leading 9 passes quickly. Data built from many such multiplicative steps, spread over several powers of ten, ends up with each leading digit's share equal to the width of its band on a log scale, which is exactly log₁₀(1 + 1/d). The law is also scale-invariant: converting amounts from dollars to euros leaves the first-digit shares unchanged.
Common mistakes
- Testing data with a narrow range. Adult heights in centimetres almost all start with 1, and that says nothing about fraud.
- Testing assigned numbers such as invoice IDs, account numbers or phone numbers. They are labels, not measurements.
- Treating a chi-square rejection on a very large file as proof of a problem. Check the MAD and the size of the gaps.
- Drawing conclusions from a few dozen values. Sampling noise is large at that size.
- Mixing different kinds of numbers, such as quantities and amounts, in one test.
Common questions
What is Benford's law?
In many sets of naturally occurring numbers, the leading digit is more often small than large. About 30.1% of values start with 1, 17.6% with 2, and only 4.6% with 9. The expected share for digit d is log₁₀(1 + 1/d). Frank Benford documented it in 1938 across river areas, populations, physical constants and more; Simon Newcomb had noticed it in 1881.
Which data should follow Benford's law?
Data that spans several orders of magnitude and arises from multiplying or compounding processes: invoice and payment amounts, populations, stock prices, river lengths. Data with a fixed range or assigned values does not: heights of adults, test scores, phone numbers, ZIP codes, or prices set at $9.99.
Does a failed Benford test prove fraud?
No. It shows that the digits are distributed differently from Benford's pattern, which can have innocent causes: a minimum or maximum amount, a price list, a spending threshold, or a dataset that never spanned enough magnitudes. Auditors use it to decide where to look, then check the individual records.
Why use the MAD rather than the chi-square test?
The chi-square test's power grows with the sample size. With tens of thousands of records it rejects Benford for differences too small to matter. Mark Nigrini's mean absolute deviation (MAD) does not depend on n in the same way, and he set thresholds for it from many real datasets.
How many numbers do I need?
A few hundred at the very least, and ideally a thousand or more. With 150 values, as in the example, random variation alone moves each digit's share by a percentage point or two, and the MAD can land near the thresholds by chance. The calculator warns below 100 values.
Related calculators
-
Chi-square calculator
Goodness-of-fit and independence tests for any counts.
-
Histogram maker
See the whole distribution of your values, not just the first digits.
-
Descriptive statistics
Mean, spread and shape of the same data.