Hypergeometric distribution calculator
Enter the population size N, the number of successes K in it, and the sample size n. The calculator gives the probability of exactly, at most or at least k successes in the sample, and a table of every possible value.
Total items, e.g. 52 cards.
e.g. 13 hearts.
Drawn without replacement.
Between 0 and 1. Gives the smallest k with P(X ≤ k) ≥ p.
Each bar is P(X = k). Solid bars are the values included in the answer.
| k | P(X = k) | P(X ≤ k) | P(X ≥ k) |
|---|---|---|---|
| 0 | 0.221534 | 0.221534 | 1 |
| 1 | 0.41142 | 0.632953 | 0.778466 |
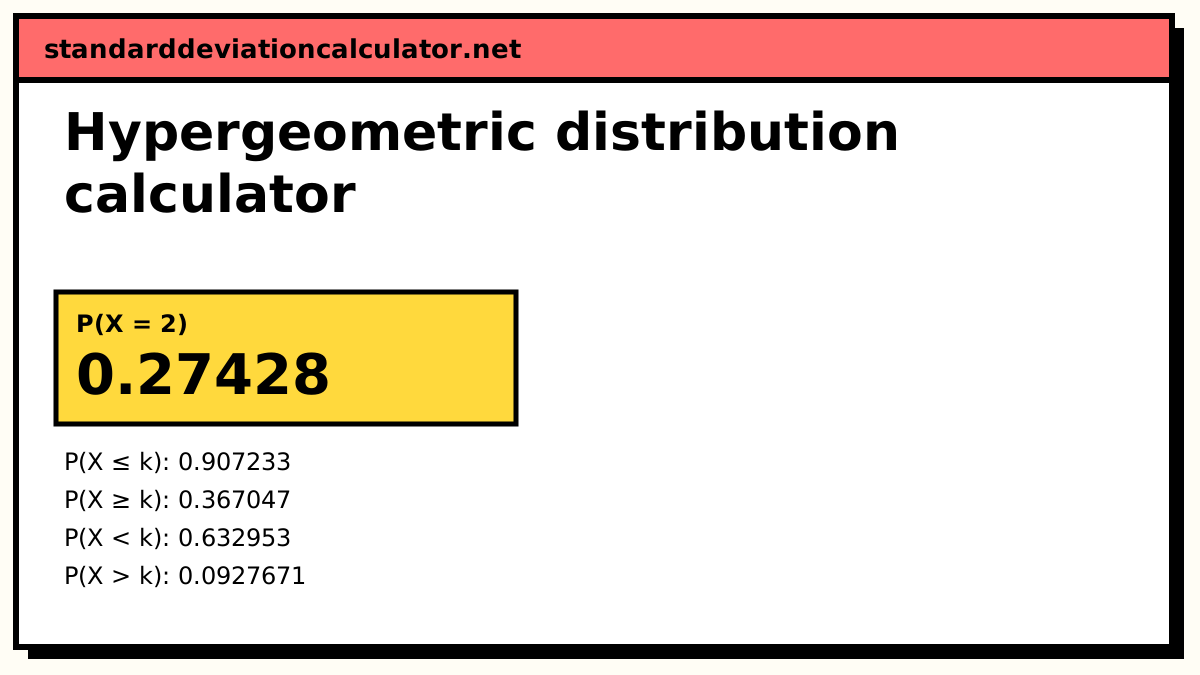
| 2 | 0.27428 | 0.907233 | 0.367047 |
| 3 | 0.0815426 | 0.988776 | 0.0927671 |
| 4 | 0.0107293 | 0.999505 | 0.0112245 |
Show the working, step by step
Possible values of k run from max(0, n − (N − K)) to min(n, K):
k = 0, …, 5
Ways to choose the sample:
C(N, n) = C(52, 5) = 2,598,960
Probability of exactly k:
P(X = k) = C(K, k) × C(N − K, n − k) / C(N, n) P(X = 2) = C(13, 2) × C(39, 3) / C(52, 5) = 78 × 9,139 / 2,598,960 = 0.27428
The formulas
P(X = k) = C(K, k) × C(N − K, n − k) / C(N, n) max(0, n − N + K) ≤ k ≤ min(n, K)
mean = nK/N variance = n (K/N)(1 − K/N) (N − n)/(N − 1)
C(a, b) is the number of ways to choose b items from a. The numerator counts the hands with exactly k successes and n − k failures; the denominator counts all possible hands.
Worked example
You are dealt 5 cards from a shuffled 52-card deck. What is the probability of exactly 2 hearts?
C(13, 2) = 78 C(39, 3) = 9,139 C(52, 5) = 2,598,960 P(X = 2) = 78 × 9,139 / 2,598,960 = 712,842 / 2,598,960 = 0.27428
Just over a quarter of hands hold exactly two hearts. The full table shows the rest: P(X = 0) = 0.221534, P(X = 1) = 0.41142, and so P(X ≤ 2) = 0.907233. The chance of at least one heart is 1 − 0.221534 = 0.778466.
The mean is 5 × 13/52 = 1.25 hearts. The variance is 5 × 0.25 × 0.75 × 47/51 = 0.863971, a little less than the binomial's 0.9375 because of the finite population correction. The mode is 1: one heart is the most common result.
Reading the result
The table lists every possible k, with P(X = k), P(X ≤ k) and P(X ≥ k) side by side, so you can read off “at least” and “at most” questions without subtracting. The solid bars on the chart are the values included in your answer. When N is small, check the smallest and largest possible k in the working: the support is often narrower than 0 to n.
Quality control sampling
Acceptance sampling is a common real use. A batch of N = 200 parts contains K = 6 defectives; an inspector tests n = 20 and rejects the batch if any are defective. The chance of catching the problem is 1 − P(X = 0) = 1 − C(194, 20)/C(200, 20), about 0.47. That is lower than many people expect, and the table shows why: with so few defectives, most samples miss them all. Raising n, or tightening the batch, is the only way to push the detection probability up.
Common mistakes
- Using the binomial for small populations. For 2 hearts in 5 cards the binomial with p = 0.25 gives 0.2637, not 0.2743.
- Mixing up K and n. K counts successes in the whole population; n is how many you draw.
- Calculating “at least one” by adding. It is quicker and safer as 1 − P(X = 0).
Common questions
When should I use the hypergeometric distribution instead of the binomial?
When you draw without replacement from a finite population, so each draw changes the odds for the next one: cards from a deck, defective items from a batch, jurors from a pool. The binomial assumes the probability stays fixed, which is true only with replacement or when the population is so large that removing a few items barely matters (roughly, n below 5% of N).
What do N, K, n and k stand for?
N is the population size, K the number of successes in it, n the number you draw and k the number of successes you want in the sample. For hearts in a poker hand: N = 52 cards, K = 13 hearts, n = 5 cards drawn, k = the number of hearts.
What is the finite population correction?
The factor (N − n)/(N − 1) in the variance. Drawing without replacement makes the count less variable than a binomial with the same p = K/N, because extreme runs use up the supply. For 5 cards from 52 it is 47/51 = 0.921569.
Why can k not be 0 in some problems?
The smallest possible k is max(0, n − (N − K)). Drawing 5 items from 10 of which 8 are successes leaves only 2 failures to draw, so at least 3 successes are guaranteed and P(X = 0) = P(X = 1) = P(X = 2) = 0.
Is this what Fisher’s exact test uses?
Yes. With the row and column totals of a 2×2 table fixed, the top-left count is hypergeometric, and Fisher's exact test adds up the hypergeometric probabilities of tables as or more extreme than the one observed.
Related calculators
-
Binomial distribution
The with-replacement version, with a fixed success probability.
-
Permutations and combinations
The C(n, k) counts the formula is built from.
-
Probability calculator
And, or and at-least-one probabilities.