Weibull distribution calculator
Enter the shape k and scale λ, then a time x. The calculator gives the probability of failure by x, survival past x, failure between two times, or the time by which a given share has failed.
k < 1: failure rate falls over time; k = 1: constant (exponential); k > 1: wear-out.
Greater than 0: 63.2% of items fail by time λ.
Between 0 and 1, e.g. 0.95 or 95%.
The curve is the probability density; the shaded area is the probability asked for.
| P(X ≤ x) | 0.01 | 0.05 | 0.25 | 0.5 | 0.75 | 0.95 | 0.99 |
|---|---|---|---|---|---|---|---|
| x | 0.18629 | 0.55221 | 1.7432 | 3.1329 | 4.9731 | 8.3124 | 11.072 |
Show the working, step by step
The moments use the gamma function:
Γ(1 + 1/k) = Γ(1.66667) = 0.902745 mean = λ Γ(1 + 1/k) = 4 × 0.902745 = 3.61098
Put x into the cumulative distribution function F(x) = P(X ≤ x):
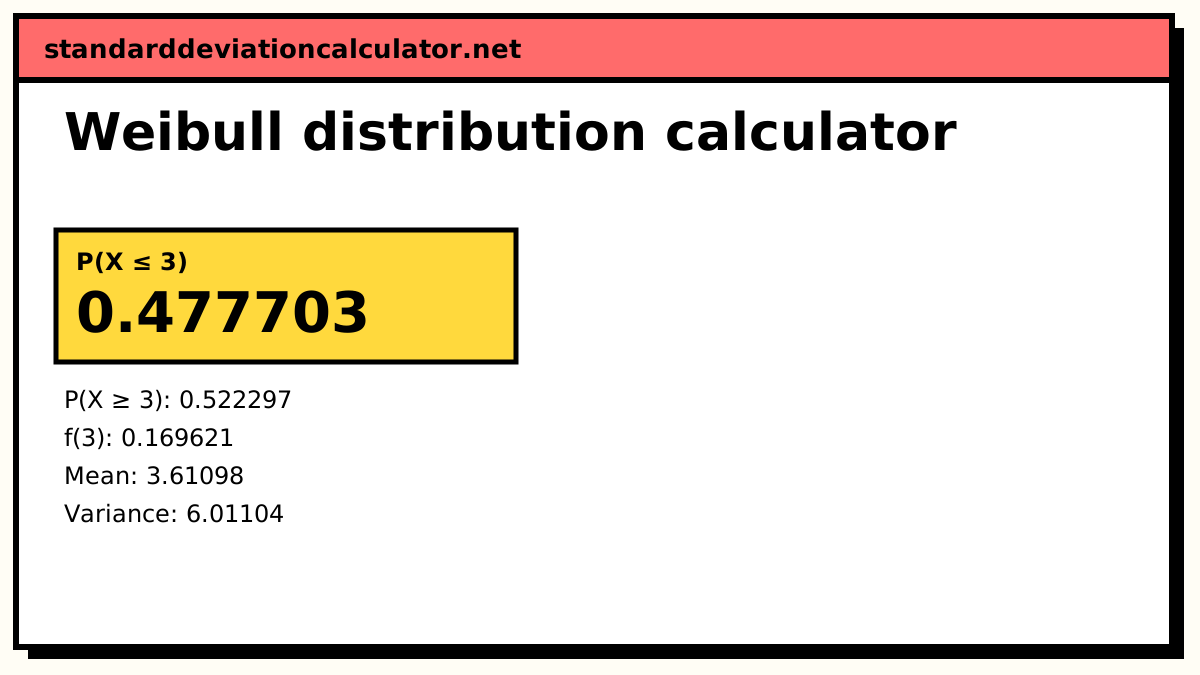
F(x) = 1 − e−(x/λ)k (x/λ)k = (3 / 4)1.5 = 0.649519 F(3) = 1 − e−0.649519 = 0.477703
The formulas
f(x) = (k/λ)(x/λ)k−1 e−(x/λ)k, x ≥ 0 F(x) = 1 − e−(x/λ)k R(x) = P(X ≥ x) = e−(x/λ)k xp = λ(−ln(1 − p))1/k
mean = λΓ(1 + 1/k) variance = λ²[Γ(1 + 2/k) − Γ(1 + 1/k)²] median = λ(ln 2)1/k mode = λ((k − 1)/k)1/k for k > 1, else 0
Worked example
A pump seal's life in years follows a Weibull distribution with shape k = 1.5 and scale λ = 4. What fraction of seals fail within 3 years?
(x/λ)k = (3/4)1.5 = 0.649519 P(X ≤ 3) = 1 − e−0.649519 = 0.477703
About 47.8% of seals fail within 3 years, so the 3-year reliability is 0.522297. The mean life is 4 × Γ(1.66667) = 4 × 0.902745 = 3.61098 years, the standard deviation is 2.45174 years, the median is 4 × (ln 2)1/1.5 = 3.13288 years and the mode, the most common failure age, is 4 × (0.5/1.5)1/1.5 = 1.923 years.
For a warranty you might want the B10 life, the age by which 10% have failed: 4 × (−ln 0.9)1/1.5 = 0.892302 years, a little under 11 months.
Reading the result
Look at k before anything else. With k = 1.5 the failure rate rises slowly as seals age, so preventive replacement makes some sense. With k below 1 replacing a working part early would make things worse, because new parts are the ones most likely to fail. The chart's shaded area is the failure probability you asked for.
Estimating k and λ
From failure data, the usual quick method is a Weibull plot: sort the failure times, give each a median-rank estimate of F, and plot ln(−ln(1 − F)) against ln x. A Weibull sample falls near a straight line whose slope is k; λ is the time where the line crosses zero. Maximum likelihood gives better estimates, especially with censored data (items still running when the test stopped), and most reliability software reports it. Once you have k and λ, this calculator gives any probability or percentile you need.
Common mistakes
- Swapping k and λ. The shape is dimensionless; the scale is in time units, like the answer.
- Treating λ as the mean. It is the 63.2nd percentile; the mean is λΓ(1 + 1/k), which is below λ whenever k It is the 63.2th percentile; the mean is λΓ(1 + 1/k), which is below λ for most k between 1 and 3.6.gt; 1.
- Confusing this λ with a rate. In the exponential distribution λ is a rate (per time); in this Weibull form it is a time. With k = 1 the Weibull's λ equals 1/rate.
Common questions
What do the shape k and scale λ mean?
The shape k decides how the failure rate changes with age. k < 1: the rate falls, as with early “infant mortality” failures. k = 1: the rate is constant and the Weibull is the exponential distribution. k > 1: the rate rises, as parts wear out. The scale λ is the characteristic life: 63.2% of items have failed by time λ, whatever k is, because F(λ) = 1 − e−1.
How do I get the mean of a Weibull distribution?
mean = λ Γ(1 + 1/k), where Γ is the gamma function. With k = 1.5 and λ = 4, Γ(1.66667) = 0.902745, so the mean is 3.61098. The variance is λ²[Γ(1 + 2/k) − Γ(1 + 1/k)²] = 6.01104.
What is the B10 life?
The time by which 10% of items have failed: the 10th percentile, λ(−ln 0.9)1/k. For k = 1.5 and λ = 4 it is 0.892302. Bearing makers quote B10 life as their rating; pick “x from a probability” and enter 0.1 to get it.
Some books write the Weibull with β and η. Is that the same?
Yes. Reliability engineers often call the shape β and the scale η; statistics texts use k and λ, or α and β. The formula F(x) = 1 − exp(−(x/η)β) is the same. Watch for a third, location parameter γ in some software: this calculator uses the two-parameter form with γ = 0.
What is the hazard rate?
The instantaneous failure rate among items still working: h(x) = (k/λ)(x/λ)k−1. At the mean life of 3.61 in the default, h = 0.356 failures per unit time. It rises with x because k > 1.
Related calculators
-
Exponential distribution
The Weibull with k = 1: a constant failure rate.
-
Rayleigh distribution
The Weibull with k = 2.
-
Lognormal distribution
The other common model for lifetimes and repair times.