Inverse normal distribution calculator
Enter an area (probability), say where that area lies, and give the mean and standard deviation. The calculator returns the cut-off value x, or the pair of cut-offs for a central or two-tailed area, together with the z-score.
Between 0 and 1, e.g. 0.95 or 95%.
Use μ = 0 and σ = 1 for a z-score.
The curve is the probability density; the shaded area is the probability asked for.
| Left-tail area | z | x |
|---|---|---|
| 0.9 | 1.2816 | 119.223 |
| 0.95 | 1.6449 | 124.673 |
| 0.975 | 1.96 | 129.399 |
| 0.99 | 2.3263 | 134.895 |
| 0.995 | 2.5758 | 138.637 |
Show the working, step by step
Turn the area into the probability to the left of a cut-off.
The area to the left is the probability itself: 0.95.
Find z from the inverse standard normal CDF:
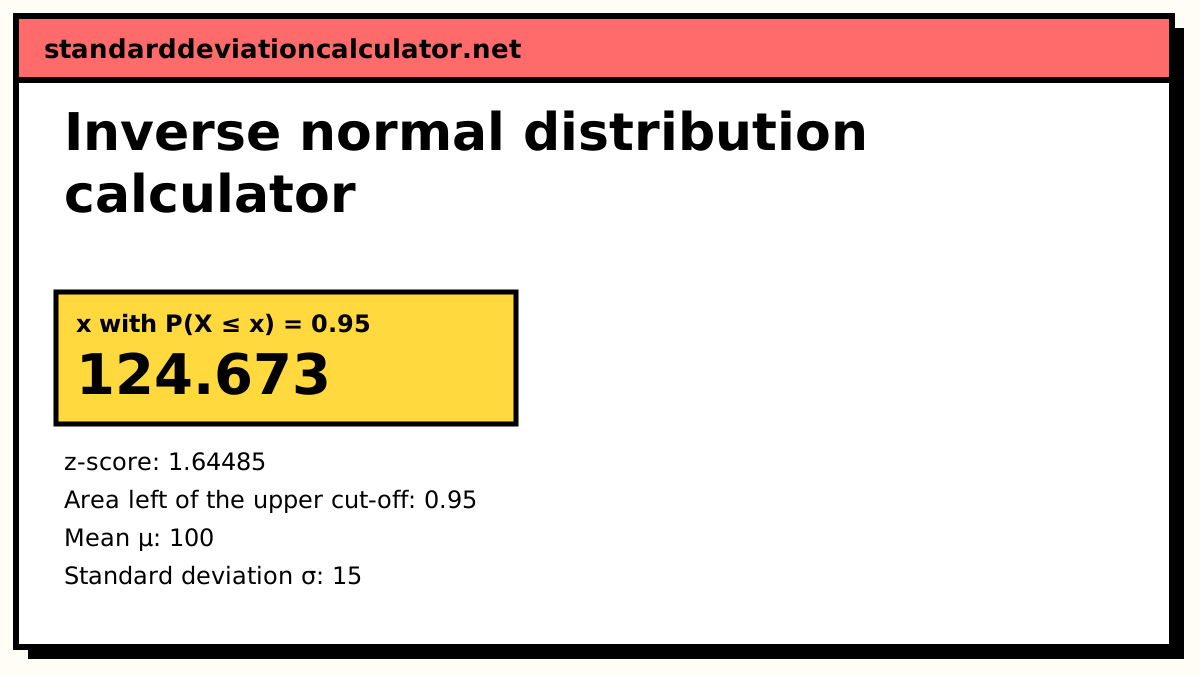
z = Φ⁻¹(0.95) = 1.64485
Convert z back to the scale of X:
x = μ + zσ = 100 + 1.64485 × 15 = 124.673
Φ⁻¹ is evaluated with Acklam’s rational approximation, accurate to about 1 part in a billion.
The formula
x = μ + zσ, z = Φ⁻¹(pleft)
Φ⁻¹ is the inverse of the standard normal CDF, and pleft is the area to the left of the cut-off. Each area type converts to pleft differently:
left tail A: pleft = A right tail A: pleft = 1 − A central area A: pleft = (1 + A)/2, cut-offs μ ± zσ two tails total A: pleft = 1 − A/2, cut-offs μ ± zσ
Worked example
IQ scores are normal with μ = 100 and σ = 15. What score marks the 95th percentile, so that 95% of people score at or below it?
z = Φ⁻¹(0.95) = 1.64485 x = 100 + 1.64485 × 15 = 124.673
A score of about 124.7 is the 95th percentile. Other settings with the same μ and σ:
- Top 10% (right tail 0.1): z = Φ⁻¹(0.9) = 1.28155, x = 100 + 1.28155 × 15 = 119.223.
- Middle 95% (central 0.95): z = Φ⁻¹(0.975) = 1.95996, so the cut-offs are 100 ± 29.3995, that is 70.6005 and 129.399.
- Two tails totalling 0.05: the same z = ±1.95996 and the same cut-offs, described from the outside.
Reading the result
The shaded area on the chart is the probability you entered, so you can check at a glance that the region is on the side you meant. A left-tail area above 0.5 gives a cut-off above the mean and a positive z; below 0.5 the cut-off falls below the mean. The table under the chart lists the common one-sided percentiles for your μ and σ, useful for building confidence intervals and tolerance limits.
Where you need it
Grading on a curve (the score that puts a student in the top 15%), quality limits (the thickness that only 1% of parts exceed), confidence intervals (the z for 90%, 95% or 99% coverage) and sample-size formulas all need the inverse normal. So do reference ranges in medicine, which are usually the central 95% of healthy values: μ ± 1.95996σ. If your data are clearly skewed, the normal percentiles will be off in the tails, and a lognormal or an empirical percentile is safer.
Common mistakes
- Entering a right-tail area as a left-tail one. “Top 10%” is a right tail of 0.1, which is the 90th percentile, not the 10th.
- Using 1.645 for a 95% two-sided interval. Two-sided 95% needs 1.95996; 1.645 is one-sided 95% (or two-sided 90%).
- Entering a percentage as a whole number. Type 0.95 or 95%, not 95.
- Entering the variance as σ. If you know σ² = 225, the standard deviation is 15.
Common questions
What does the inverse normal distribution calculate?
It runs the normal distribution backwards. A normal calculator takes a value x and returns an area (a probability); the inverse takes the area and returns x. Use it for percentiles, cut-off scores and critical values: “what score puts someone in the top 10%?”
Is this the same as invNorm on a TI-84?
Yes. invNorm(0.95, 100, 15) returns 124.673, the same as the default here. The TI-84 also has a tail setting (LEFT, RIGHT, CENTER); the “area is” drop-down does the same job, plus a two-tailed option. In Excel the function is NORM.INV(0.95, 100, 15).
What is the difference between central and two-tailed?
They are complements. A central area of 0.95 puts 95% in the middle and 2.5% in each tail; a two-tailed area of 0.05 puts 5% in the tails combined. Both give z = ±1.95996 and the same cut-offs. Pick whichever matches how your problem is worded.
How do I get a z-score instead of x?
Set μ = 0 and σ = 1. The answer x is then a z-score. The z-score is also always shown in the results for any μ and σ, since x = μ + zσ.
How accurate is the answer?
Φ⁻¹ is computed with Acklam's rational approximation, which has a relative error below 1.2 × 10⁻⁹ across the whole range, far more precise than any printed z-table.
Related calculators
-
Normal distribution
The forward direction: from x to a probability.
-
Z-score calculator
Standardise a value against a mean and SD.
-
Critical value calculator
z, t, chi-square and F critical values for tests.