Uniform distribution calculator
Enter the minimum a and maximum b and choose continuous or discrete. The calculator gives the probability of landing at most, at least, exactly or between given values, with the mean, variance, standard deviation and a chart.
Between 0 and 1. For a discrete variable, gives the smallest x with P(X ≤ x) ≥ p.
The curve is the probability density; the shaded area is the probability asked for.
| P(X ≤ x) | 0.01 | 0.05 | 0.25 | 0.5 | 0.75 | 0.95 | 0.99 |
|---|---|---|---|---|---|---|---|
| x | 0.1 | 0.5 | 2.5 | 5 | 7.5 | 9.5 | 9.9 |
Show the working, step by step
Put x into the cumulative distribution function F(x) = P(X ≤ x):
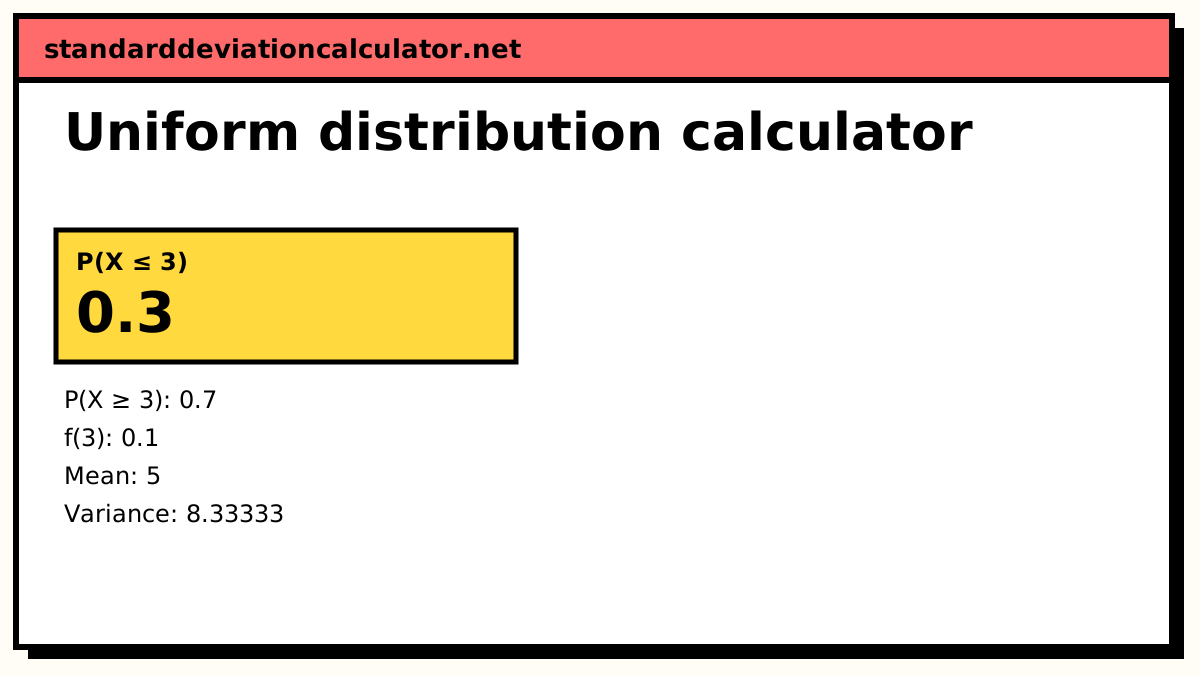
F(x) = (x − a) / (b − a) F(3) = (3 − 0) / (10 − 0) = 3 / 10 = 0.3
The formulas
Continuous uniform on [a, b]:
f(x) = 1 / (b − a), a ≤ x ≤ b F(x) = (x − a) / (b − a) mean = (a + b)/2 variance = (b − a)² / 12
Discrete uniform on the n = b − a + 1 whole numbers from a to b:
P(X = k) = 1/n P(X ≤ k) = (k − a + 1) / n mean = (a + b)/2 variance = (n² − 1) / 12
Worked example: continuous
A bus comes at a random moment in the next 10 minutes, so the wait is uniform on 0 to 10. What is the chance of waiting 3 minutes or less?
P(X ≤ 3) = (3 − 0) / (10 − 0) = 0.3
There is a 30% chance, and a 70% chance of waiting longer. The density is a flat 1/10 = 0.1 per minute. The mean and median wait are both 5 minutes, the variance is 10²/12 = 8.33333 and the standard deviation is 2.88675 minutes. The chance of a wait between 2 and 5 minutes is simply the width of that interval over the whole width: 3/10 = 0.3.
Worked example: discrete
Switch the type to discrete and keep a = 0, b = 10: now X is a whole number from 0 to 10, with n = 11 equally likely values. P(X ≤ 3) counts the four values 0, 1, 2 and 3:
P(X ≤ 3) = 4 / 11 = 0.363636
That is larger than the continuous 0.3, because the discrete version includes the whole value 3 itself. For a fair die (a = 1, b = 6), P(X ≥ 5) = 2/6 = 0.333333, the mean is 3.5 and the variance is (36 − 1)/12 = 2.91667.
Reading the result
For the continuous type the chart is a rectangle, and the shaded part is a smaller rectangle whose area is the probability. For the discrete type each bar has the same height 1/n and the solid bars are the values counted in the answer. The calculator reports the lower median for the discrete case: the smallest value with P(X ≤ k) ≥ 0.5.
Common mistakes
- Forgetting the +1 in the discrete count. The whole numbers from 1 to 6 are 6 values, not 5.
- Using the continuous variance for a die. (6 − 1)²/12 = 2.083 is wrong; (6² − 1)/12 = 2.917 is right.
- Asking for P(X = x) in the continuous case. It is always 0; the calculator says so and shows P(X ≤ x) instead.
Common questions
What is the difference between the continuous and discrete uniform distribution?
The continuous uniform spreads probability evenly over every real number from a to b, so any interval of the same width is equally likely and a single point has probability 0. The discrete uniform puts equal probability 1/n on each of the n whole numbers a, a + 1, …, b, like the faces of a fair die. Their variances differ: (b − a)²/12 against (n² − 1)/12.
What is the standard deviation of a uniform distribution?
For the continuous uniform, (b − a)/√12 ≈ 0.2887(b − a). For a to b = 0 to 10 that is 2.88675. For a fair six-sided die (discrete, 1 to 6), √(35/12) = 1.70783.
Is P(X < x) the same as P(X ≤ x)?
For the continuous uniform, yes, because P(X = x) = 0. For the discrete uniform, no: on a die, P(X ≤ 4) = 4/6 but P(X < 4) = 3/6. Choose the discrete type to see every version.
What is the mode of a uniform distribution?
There isn't a single one. Every value in the range is equally likely, so every value is a mode. The mean and median are both the midpoint (a + b)/2.
Where is the uniform distribution used?
Rounding errors (uniform on ±0.5 units), random number generators, the arrival time of a bus known only to come “sometime in the next 10 minutes”, and as the flat Bayesian prior Beta(1, 1). It is also the starting point for simulation: feeding a uniform random number into an inverse CDF generates a draw from any other distribution.
Related calculators
-
Beta distribution
Beta(1, 1) is the uniform on 0 to 1; other shapes bend it.
-
Probability calculator
Combine the probabilities of two events.
-
Exponential distribution
Waiting times when events have no fixed window.