Rayleigh distribution calculator
Enter the scale σ and a value x. The calculator gives the probability below, above or between values for a Rayleigh distribution, or the value at any percentile, with the summary statistics and a chart.
Greater than 0. It is also the mode.
Between 0 and 1, e.g. 0.95 or 95%.
The curve is the probability density; the shaded area is the probability asked for.
| P(X ≤ x) | 0.01 | 0.05 | 0.25 | 0.5 | 0.75 | 0.95 | 0.99 |
|---|---|---|---|---|---|---|---|
| x | 0.28355 | 0.64058 | 1.5171 | 2.3548 | 3.3302 | 4.8955 | 6.0697 |
Show the working, step by step
Put x into the cumulative distribution function F(x) = P(X ≤ x):
F(x) = 1 − e−x² / (2σ²) F(3) = 1 − e−9 / 8 = 1 − 0.324652 = 0.675348
The formulas
f(x) = (x / σ²) e−x² / (2σ²), x ≥ 0 F(x) = 1 − e−x² / (2σ²) xp = σ √(−2 ln(1 − p))
mean = σ√(π/2) variance = (4 − π)σ² / 2 median = σ√(2 ln 2) mode = σ
Worked example
The horizontal miss distance of a drone's landing from its target has east and north errors that are each normal with mean 0 and σ = 2 metres. What is the probability that it lands within 3 metres of the target?
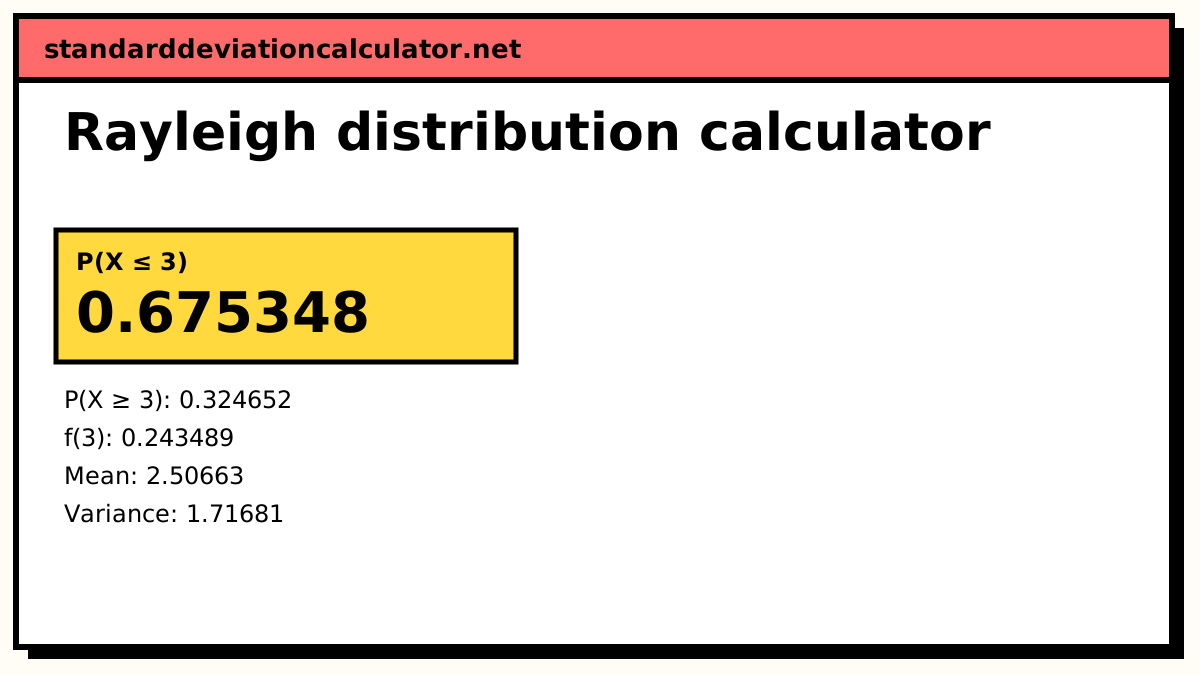
P(X ≤ 3) = 1 − e−3² / (2 × 2²) = 1 − e−9/8 = 1 − 0.324652 = 0.675348
About 67.5% of landings are within 3 m, and 32.5% are further out. The density at 3 m is (3/4) × 0.324652 = 0.243489 per metre.
The most likely miss distance is the mode, σ = 2 m. The median is 2√(2 ln 2) = 2.35482 m, and the mean is 2√(π/2) = 2.50663 m, with variance (4 − π) × 4 / 2 = 1.71681 and standard deviation 1.31027 m. To find the radius that contains 90% of landings, use the percentile formula: 2 × √(−2 ln 0.1) = 4.29193 m. The 50% radius, the median 2.35482 m, is what ballistics calls the circular error probable (CEP).
Reading the result
The curve starts at zero, rises to its peak at σ and has a moderate right tail. It starts at zero because hitting very close to the centre needs both components to be small at once, which is unlikely even though each component alone is most likely near 0. The shaded area on the chart is the probability you asked for.
Where it is used
Signal engineers use the Rayleigh distribution for the envelope of a radio signal with no direct line of sight, where many reflected paths add up with random phases. Wind-energy studies use it as a one-parameter wind-speed model when only the average speed is known: set σ = mean / 1.2533. Ocean engineers use it for individual wave heights in a sea state. In each case the physical picture is the same, a length built from two independent, equally spread normal components.
Common mistakes
- Entering the SD of the distance as σ. σ is the SD of each component (and the mode); the SD of the distance is only 0.655σ.
- Using the Rayleigh when the components have different spreads or a non-zero mean. Then the length follows a Hoyt or Rice distribution instead.
- Treating the density as a probability. f(3) = 0.2435 is a height per metre, not the chance of exactly 3 m.
Common questions
Where does the Rayleigh distribution come from?
It is the distribution of the length of a two-dimensional vector whose x and y components are independent normal variables with mean 0 and the same standard deviation σ: R = √(X² + Y²). Wind speed from two independent components, the miss distance of shots around a target, and the amplitude of a radio signal in multipath fading all follow it.
What does σ mean in the Rayleigh distribution?
σ is the standard deviation of each underlying normal component, and it is also the mode of the Rayleigh distribution, the most likely value of R. It is not the standard deviation of R, which is σ√((4 − π)/2) ≈ 0.655σ.
How is it related to the Weibull and chi distributions?
A Rayleigh distribution with scale σ is a Weibull with shape k = 2 and scale λ = σ√2. It is also a chi distribution with 2 degrees of freedom scaled by σ, and R² follows an exponential distribution with mean 2σ².
How do I estimate σ from data?
The maximum-likelihood estimate is σ̂ = √(Σr² / (2n)). If you only know the sample mean r̄, σ ≈ r̄ / √(π/2) = r̄ / 1.2533.
Related calculators
-
Weibull distribution
Rayleigh is the Weibull with shape k = 2.
-
Normal distribution
The two components whose combined length is Rayleigh.
-
Exponential distribution
The distribution of R², the squared length.