Relative frequency calculator
Enter a list of values or a table of counts. The calculator gives each one's relative frequency as a fraction, decimal and percentage, plus the cumulative relative frequency and a bar chart.
Numbers or words (such as survey answers), separated by commas or new lines.
| Value | f | f / n | Relative f | Percent | Cumulative relative f |
|---|---|---|---|---|---|
| 1 | 3 | 3/20 | 0.15 | 15% | 0.15 |
| 2 | 3 | 3/20 | 0.15 | 15% | 0.3 |
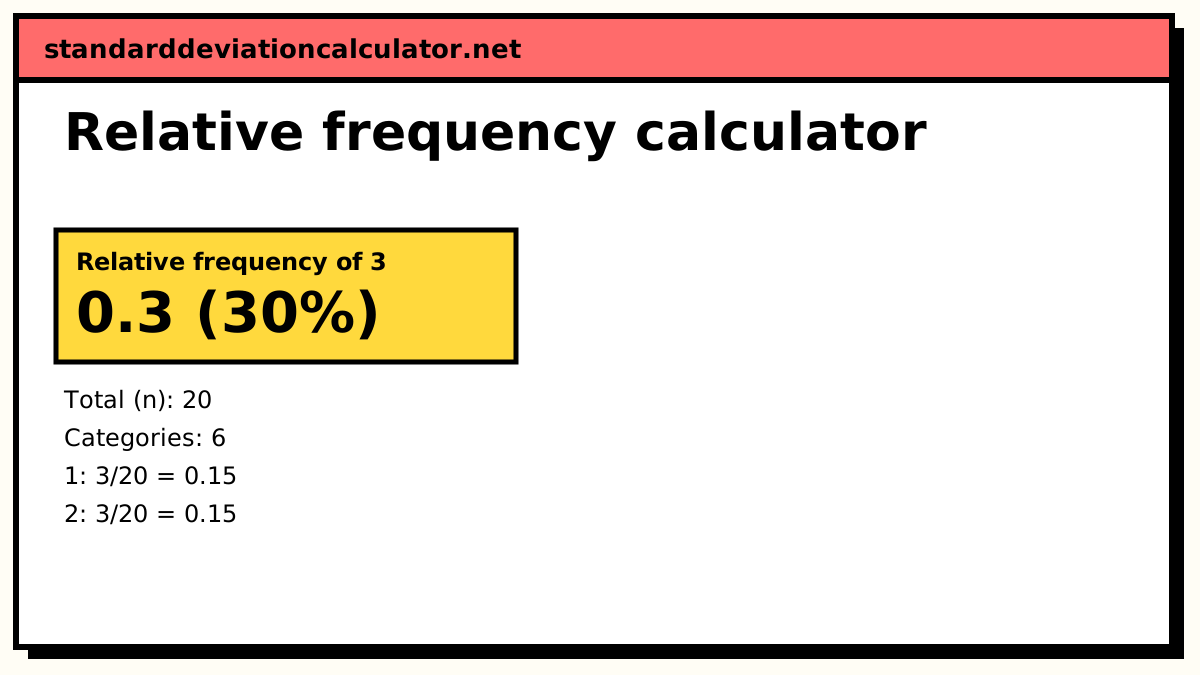
| 3 | 6 | 3/10 | 0.3 | 30% | 0.6 |
| 4 | 3 | 3/20 | 0.15 | 15% | 0.75 |
| 5 | 2 | 1/10 | 0.1 | 10% | 0.85 |
| 6 | 3 | 3/20 | 0.15 | 15% | 1 |
| Total | 20 | 1 | 1 | 100% |
Show the working, step by step
Count how often each value occurs and add the counts to get n.
n = 3 + 3 + 6 + 3 + 2 + 3 = 20
Divide each count by n.
1: 3 ÷ 20 = 0.15 2: 3 ÷ 20 = 0.15 3: 6 ÷ 20 = 0.3 4: 3 ÷ 20 = 0.15 5: 2 ÷ 20 = 0.1 6: 3 ÷ 20 = 0.15
The relative frequencies add to 1 (100%). Running totals give the cumulative relative frequency, which ends at 1.
0.15, 0.3, 0.6, 0.75, 0.85, 1
A relative frequency is an estimate of probability: with more observations it settles toward the true chance.
The formula
relative frequency = f ÷ n cumulative relative frequency = (f₁ + f₂ + … + fᵢ) ÷ n
Here f is how often a value occurs and n is the total number of observations. Multiply by 100 for a percentage.
A worked example with values
The default is 20 rolls of a six-sided die:
1, 3, 4, 2, 6, 5, 3, 3, 1, 6, 4, 3, 2, 5, 6, 3, 4, 1, 2, 3
Tallying gives three 1s, three 2s, six 3s, three 4s, two 5s and three 6s, which add to 20.
| Face | f | f ÷ n | Relative f | Cumulative |
|---|---|---|---|---|
| 1 | 3 | 3/20 | 0.15 | 0.15 |
| 2 | 3 | 3/20 | 0.15 | 0.30 |
| 3 | 6 | 3/10 | 0.30 | 0.60 |
| 4 | 3 | 3/20 | 0.15 | 0.75 |
| 5 | 2 | 1/10 | 0.10 | 0.85 |
| 6 | 3 | 3/20 | 0.15 | 1 |
A fair die gives each face a probability of 1/6 ≈ 0.167. Five faces came close to that, but the 3 came up 30% of the time. Twenty rolls is a small sample: a chi-square goodness-of-fit test on these counts gives χ² = 2.8 on 5 degrees of freedom, nowhere near significant. Roll a few hundred times and the relative frequencies should all move toward 0.167.
A worked example with counts
Switch to “Categories with their counts” for the second default: 40 students were asked how they get to school. Walk 12, bus 8, car 15 and bike 5. Then n = 12 + 8 + 15 + 5 = 40, and the relative frequencies are 12 ÷ 40 = 0.3, 8 ÷ 40 = 0.2, 15 ÷ 40 = 0.375 and 5 ÷ 40 = 0.125. Car is the most common answer at 37.5%. The cumulative column is less useful here, because walk, bus, car and bike have no natural order.
Charting relative frequencies
The bar chart above plots relative frequency instead of the count. The bars have exactly the same shape as a count chart, because every count is divided by the same n; only the scale on the vertical axis changes, to run from 0 to 1. That is what makes relative frequency charts useful for comparing groups of different sizes, such as two classes of 20 and 32 students. For grouped numeric data, the same idea gives a relative frequency histogram, and the heights of all its bars add to 1.
Common mistakes
- Dividing by the number of categories instead of the number of observations.
- Reading a relative frequency from a small sample as the exact probability.
- Reporting cumulative relative frequencies for categories with no order.
- Comparing raw counts between groups of different sizes; relative frequencies put them on the same scale.
Common questions
What is relative frequency?
The number of times a value occurs divided by the total number of observations, f ÷ n. It can be written as a fraction, a decimal or a percentage: 6 threes in 20 rolls is 6/20 = 3/10 = 0.3 = 30%. The relative frequencies of all the values add to 1.
How is relative frequency related to probability?
Relative frequency is an experimental estimate of probability. As the number of trials grows, the relative frequency of an outcome tends to settle near its true probability; this is the law of large numbers. With only 20 dice rolls, a relative frequency of 0.3 for a three is not surprising even though the true probability is 1/6.
What is cumulative relative frequency?
The running total of the relative frequencies, or the cumulative frequency divided by n. It gives the fraction of observations at or below a value. In the dice example, 0.6 of the rolls were 3 or less. The last cumulative relative frequency is always 1.
Can I enter counts I have already tallied?
Yes. Choose “Categories with their counts” and type each category with its count. The calculator adds the counts to get n and divides each by it.
Why don’t my percentages add to exactly 100%?
Rounding. Three categories of 1/3 each show as 33.33% three times, which adds to 99.99%. The unrounded values always add to exactly 1.
Related calculators
-
Frequency distribution
Grouped or ungrouped tables with every frequency column.
-
Probability calculator
And, or and at-least-one probabilities for events.
-
Pie chart calculator
Show relative frequencies as slices of a circle.