Class width calculator
Enter your data, or just the minimum and maximum, and the number of classes. The calculator gives the class width and lists the resulting class limits, boundaries and midpoints.
Leave blank to use Sturges’ rule, k = ⌈1 + log₂ n⌉.
| # | Class limits | Class boundaries | Midpoint | f |
|---|---|---|---|---|
| 1 | 42–51 | 41.5–51.5 | 46.5 | 2 |
| 2 | 52–61 | 51.5–61.5 | 56.5 | 3 |
| 3 | 62–71 | 61.5–71.5 | 66.5 | 4 |
| 4 | 72–81 | 71.5–81.5 | 76.5 | 6 |
| 5 | 82–91 | 81.5–91.5 | 86.5 | 3 |
| 6 | 92–101 | 91.5–101.5 | 96.5 | 2 |
Show the working, step by step
Sturges’ rule for n = 20:
k = ⌈1 + log₂ 20⌉ = ⌈5.322⌉ = 6
Divide the range by the number of classes.
(max − min) ÷ k = (98 − 42) ÷ 6 = 9.33333
Round up to the next data unit (1), never down, so the classes cover the maximum.
class width = 10
Start at the minimum and add the width for each lower limit; each upper limit is one unit below the next lower limit.
42–51, 52–61, 62–71, 72–81, 82–91, 92–101
Boundaries sit half a unit outside the limits; the midpoint is the average of the limits.
41.5–51.5, midpoint (42 + 51) ÷ 2 = 46.5
The formula
class width = (max − min) ÷ k, rounded up k = ⌈1 + log₂ n⌉ (Sturges' rule, if k is not given)
Rounding up is to the precision of the data: to a whole number for whole-number data, to 0.1 for data with one decimal place. If the division is already exact, add one unit so that the last class includes the maximum.
A worked example
The default data is 20 exam scores:
42, 47, 55, 58, 61, 63, 65, 67, 70, 72, 74, 75, 77, 79, 81, 84, 86, 90, 93, 98
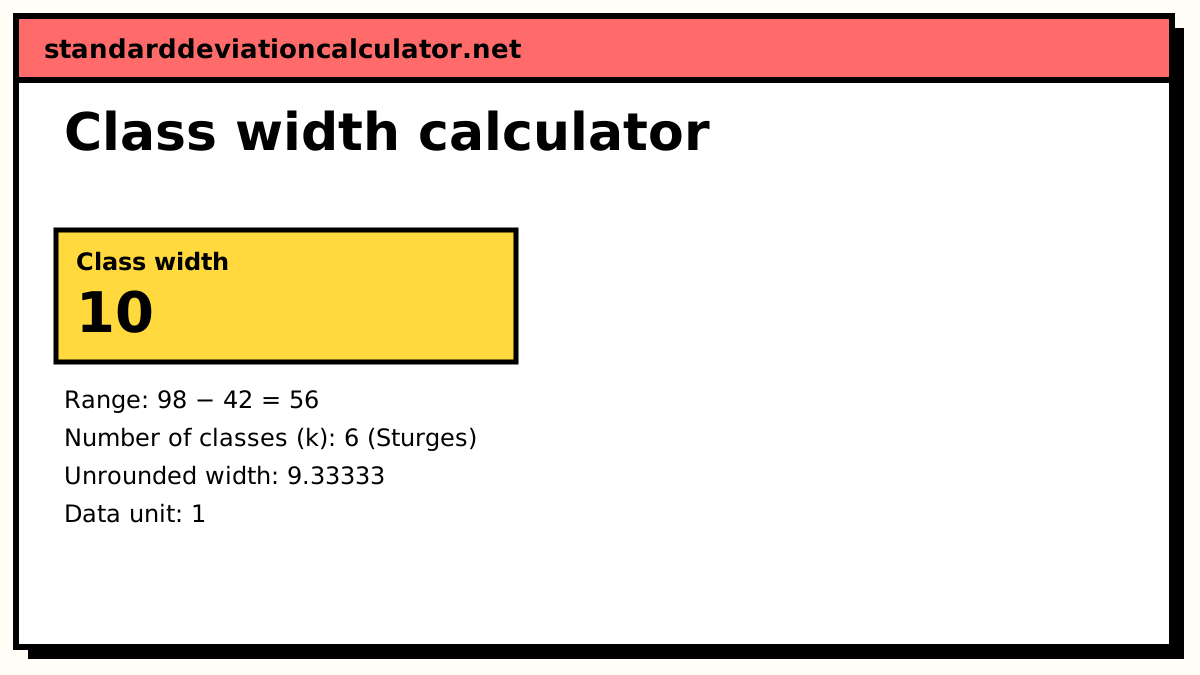
With no number of classes given, Sturges' rule gives k = ⌈1 + log₂ 20⌉ = ⌈5.32⌉ = 6. The range is 98 − 42 = 56, so the raw width is 56 ÷ 6 = 9.33, which rounds up to 10.
The first lower limit is the minimum, 42, and each later lower limit is 10 more. Each upper limit is one unit below the next lower limit. The boundaries are half a unit outside the limits, and the midpoint is the average of the two limits:
| Class limits | Boundaries | Midpoint | f |
|---|---|---|---|
| 42–51 | 41.5–51.5 | 46.5 | 2 |
| 52–61 | 51.5–61.5 | 56.5 | 3 |
| 62–71 | 61.5–71.5 | 66.5 | 4 |
| 72–81 | 71.5–81.5 | 76.5 | 6 |
| 82–91 | 81.5–91.5 | 86.5 | 3 |
| 92–101 | 91.5–101.5 | 96.5 | 2 |
The frequencies add to 20, so every score landed in exactly one class. The last class, 92–101, goes past the maximum; that is normal and is the price of a round width.
Limits, boundaries and midpoints
Class limits are the numbers you write in the table. Because the scores are whole numbers, there is a gap of one between 51 and 52, and no score can fall in it. Class boundaries close that gap by splitting it in half: 51.5 is the upper boundary of one class and the lower boundary of the next. Histograms are drawn between boundaries so the bars touch. The width can be found either way: 52 − 42 = 10 from the lower limits, or 51.5 − 41.5 = 10 from the boundaries.
If you only have the minimum and maximum, switch the menu and type them with n. The class table is the same, without the frequency column.
Data with decimals
The same steps work for measurements such as 3.2, 4.7 and 15.1 kg, but the unit is 0.1 instead of 1. With 12 values from 3.2 to 15.1 and five classes, the raw width is 11.9 ÷ 5 = 2.38, which rounds up to 2.4. The classes are 3.2–5.5, 5.6–7.9 and so on, and the boundaries are 0.05 outside the limits, such as 3.15–5.55.
Common mistakes
- Rounding 9.33 down to 9, which leaves the maximum outside the last class.
- Measuring the width within one class (51 − 42 = 9) instead of between lower limits (52 − 42 = 10).
- Starting the first class above the minimum, so the smallest value has nowhere to go.
- Rounding to the nearest whole number when the data has decimals; round up at the data's own precision.
Common questions
What is the formula for class width?
Class width = (maximum − minimum) ÷ number of classes, rounded up. For data from 42 to 98 in 6 classes, (98 − 42) ÷ 6 = 9.33, which rounds up to 10.
Why is class width always rounded up?
So the classes reach the largest value. With a width of 9 instead of 10, six classes starting at 42 would end at 95, and the value 98 would not fit anywhere.
What if the division comes out to a whole number?
Many textbooks say to add one anyway. From 10 to 50 in 4 classes, 40 ÷ 4 = 10, but classes 10–19, 20–29, 30–39 and 40–49 leave out 50. A width of 11 gives 10–20, 21–31, 32–42 and 43–53, which covers it. The calculator follows that rule and says when it applied it. For decimal data it adds one unit at the data's precision, such as 0.1.
How many classes should I use?
If the problem does not say, Sturges' rule is a common choice: k = ⌈1 + log₂ n⌉, which gives 6 classes for 20 values and 8 for 100. Another rule picks the smallest k with 2ᵏ ≥ n, which gives 5 for 20 values. Most textbook problems use between 5 and 20 classes.
How do I find the class width from a frequency table?
Subtract one lower class limit from the next: for classes 42–51 and 52–61 the width is 52 − 42 = 10. Do not subtract the limits of one class (51 − 42 = 9); that is one unit short.
Related calculators
-
Frequency distribution
Build the full table once the classes are set.
-
Histogram calculator
Other rules for choosing bins, and the chart.
-
Range calculator
Maximum minus minimum, the start of the class width formula.