Expected value calculator
Enter each outcome and its probability to get the expected value, the variance and the standard deviation of the random variable, and whether a game with those payouts is fair.
Gives the expected total and its spread over that many independent plays.
| x | P(x) | x · P(x) | (x − μ)² · P(x) |
|---|---|---|---|
| −2 | 0.6 | −1.2 | 3.9015 |
| 1 | 0.25 | 0.25 | 0.050625 |
| 5 | 0.1 | 0.5 | 1.98025 |
| 20 | 0.05 | 1 | 18.9151 |
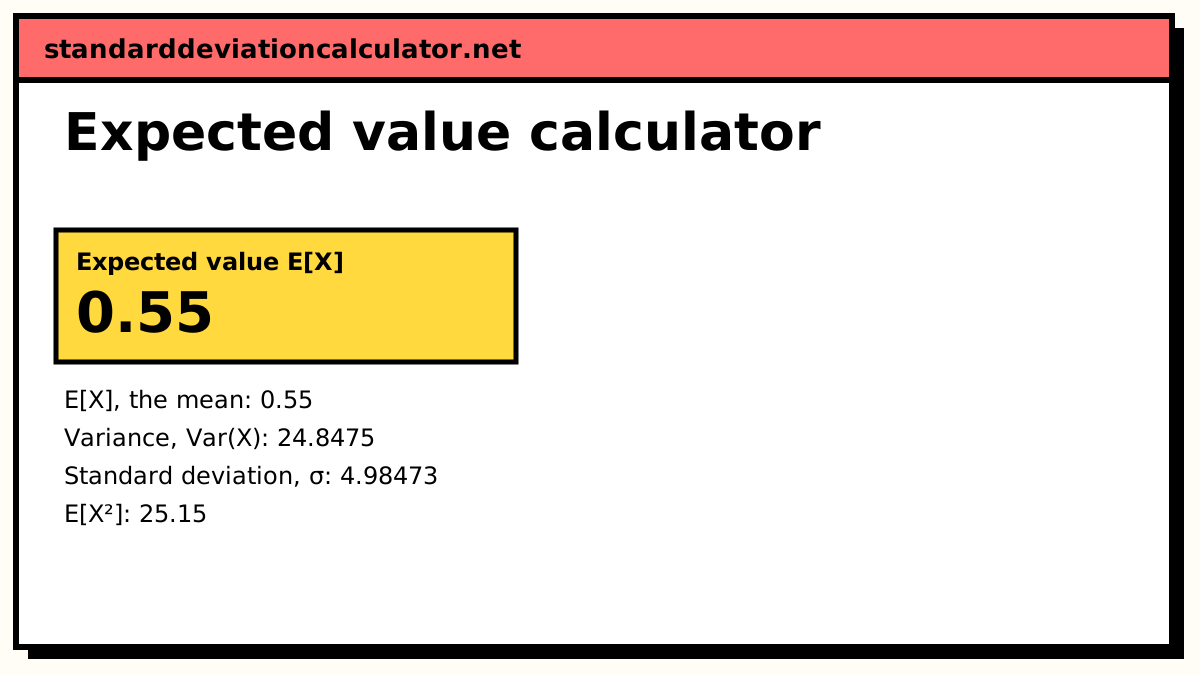
| Total | 1 | 0.55 | 24.8475 |
Show the working, step by step
Multiply each outcome by its probability and add.
E[X] = Σ x·P(x) = (−2)(0.6) + (1)(0.25) + (5)(0.1) + (20)(0.05) E[X] = 0.55
For the spread, weight each squared distance from the mean by its probability.
Var(X) = Σ (x − μ)²·P(x) = 24.8475 Check: E[X²] − μ² = 25.15 − (0.55)² = 24.8475
The standard deviation is the square root of the variance.
σ = √24.8475 = 4.98473
Over 100 independent plays, means add and variances add.
Total: 100 × 0.55 = 55 SD: √100 × 4.98473 = 49.8473
A game is fair when E[X] = 0 with X measured as the net gain after paying to play.
The formulas
E[X] = μ = Σ x · P(x) Var(X) = Σ (x − μ)² · P(x) = E[X²] − μ² σ = √Var(X)
The probabilities must add up to 1. Each outcome is weighted by how likely it is, so rare outcomes pull on the mean only as much as their probability allows. Why the variance formula takes that form, and why variances add for independent variables, is covered in standard deviation of a random variable.
A worked example
A stall game costs $2 to play. The table records the net result of one play: you lose your $2 with probability 0.6, finish $1 up with probability 0.25, $5 up with probability 0.1 and $20 up with probability 0.05.
| x | P(x) | x · P(x) |
|---|---|---|
| −2 | 0.6 | −1.2 |
| 1 | 0.25 | 0.25 |
| 5 | 0.1 | 0.5 |
| 20 | 0.05 | 1 |
| Total | 1 | 0.55 |
So E[X] = 0.55: on average a player gains 55 cents per play, and the game favours the player. For the spread, E[X²] = 4(0.6) + 1(0.25) + 25(0.1) + 400(0.05) = 25.15, so
Var(X) = 25.15 − 0.55² = 24.8475, σ = √24.8475 = 4.98473
The standard deviation of almost $5 is nine times the mean. A single play is mostly luck. Over the default 100 plays the expected total is 100 × 0.55 = $55, with a standard deviation of √100 × 4.98473 = $49.85, so a player could still easily finish behind after 100 games.
How to interpret the result
Expected value is a long-run average, not a prediction for one trial. It is the right number for decisions that repeat many times, such as pricing insurance or setting the payouts on a game. For a one-off decision the spread matters too, which is why the calculator reports σ alongside E[X].
If you measure outcomes as gross winnings rather than net gain, subtract the cost of playing from E[X] before judging fairness. A game that pays out $1.80 on average for a $2 stake has an expected net value of −$0.20.
Where expected value is used
Insurers set premiums so that the expected payout per policy, plus costs, is below the premium. Casinos set payouts so the player's expected value per bet is slightly negative; in European roulette a $1 bet on a single number pays $35 with probability 1/37 and loses $1 otherwise, so E[X] = 35/37 − 36/37 = −1/37, about −2.7 cents. In statistics, the mean of any discrete probability distribution is its expected value: a binomial variable has E[X] = np, and a Poisson variable has E[X] = λ.
Common mistakes
- Probabilities that do not sum to 1. The calculator refuses a total that is off by more than rounding; switch to frequencies if your numbers are counts.
- Mixing gross and net values. Either include the stake in every outcome, or subtract it once at the end, not both.
- Forgetting the square in the variance. Var(X) is E[X²] − μ², not E[X²] − μ.
- Reading E[X] as the most likely outcome. Here the most likely result is losing $2, but the mean is +$0.55.
Common questions
What is expected value?
The expected value E[X] is the long-run average of a random quantity: add up every possible value multiplied by its probability. It need not be a value X can actually take. A fair die has E[X] = 3.5, although no roll shows 3.5.
How do I tell whether a game is fair?
Enter the net gain of each outcome (what you win minus what you paid to play) and its probability. If E[X] = 0 the game is fair; above 0 it favours the player; below 0 it favours the house. Casino games and lotteries all have negative expected value for the player.
Can I enter frequencies instead of probabilities?
Yes. Switch the second column to frequencies or weights and the calculator divides each by their total. This is handy for data such as “12 households have 0 cars, 30 have 1, 18 have 2”.
Why do I need the standard deviation as well?
Two games can have the same expected value and very different risk. The standard deviation measures how far a typical result lands from E[X]. A lottery has a small negative mean but a huge standard deviation, because almost all the value sits in one rare prize.
What happens over many plays?
For n independent plays the expected total is n × E[X] and its standard deviation is √n × σ. The total grows with n but its spread grows only with √n, which is why the average result per play settles down near E[X] (the law of large numbers).
Related calculators
-
Lottery calculator
The expected value of a real lottery ticket, tier by tier.
-
Mean and variance
The same measures from a list of data values.
-
Binomial distribution
A discrete distribution with E[X] = np.