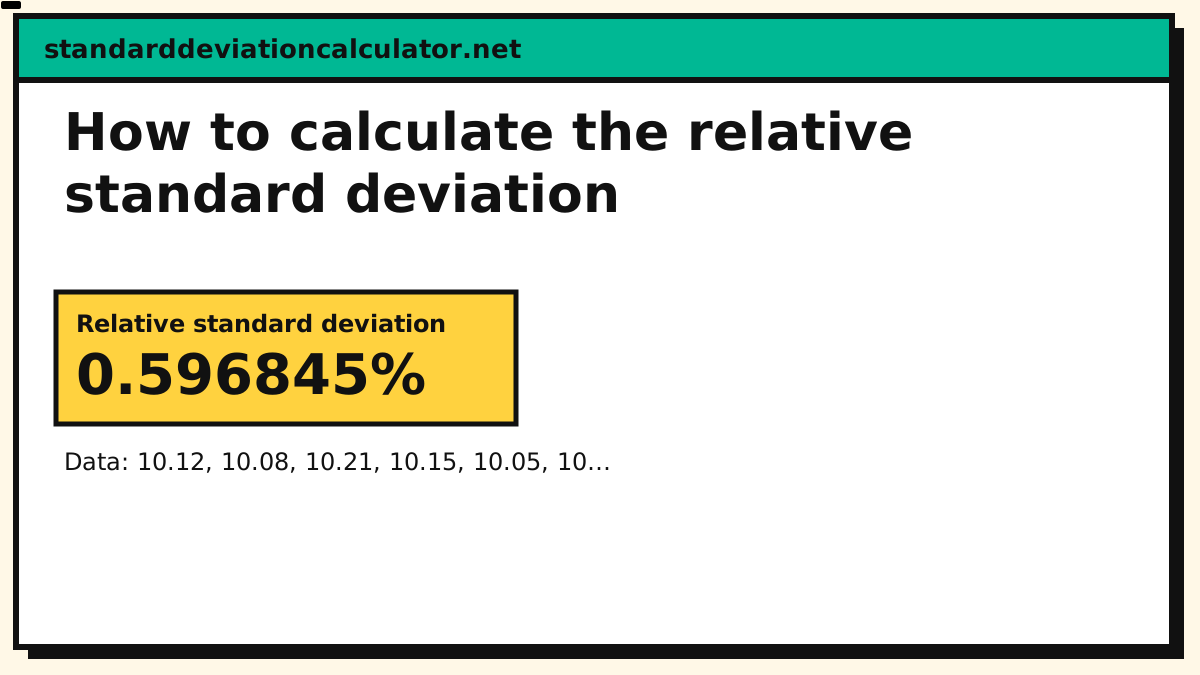
How to calculate the relative standard deviation
The relative standard deviation, %RSD, is the standard deviation as a fraction of the mean, in percent. It answers "how large is the noise relative to the signal?", which an absolute standard deviation cannot, because 0.05 of points is negligible at a mean of 100 and enormous at a mean of 0.1.
Separate numbers with commas, spaces or new lines, or paste a spreadsheet column.
Decimals and negatives are fine; write 10:3 for a value that occurs 3 times.
Your results will appear here: the standard deviation first, then the rest of the summary and a chart.
Relative standard deviation
0.596845%
The standard deviation (0.06047) is 0.597% of the mean (10.13). Because it has no units, this figure can be compared across datasets measured on different scales.
- Count (n)
- 6
- Mean (x̄)
- 10.1317
- Standard deviation (s)
- 0.0604704
- Variance (s²)
- 0.00365667
- Minimum
- 10.05
- Q1 (25%)
- 10.09
- Median
- 10.135
- Q3 (75%)
- 10.1725
- Maximum
- 10.21
- Range
- 0.16
More statistics (5)
- Standard error
- 0.0246869
- Coefficient of variation
- 0.00596845
- Sum (Σx)
- 60.79
- Sum of squares, Σ(x − x̄)²
- 0.0182833
- IQR (Q3 − Q1)
- 0.0825
Data distribution
Shaded bands mark ±1, ±2 and ±3 SD from the mean. 4 of 6 values (67%) fall within ±1 SD.
Chart as text
Mean 10.1317, sample standard deviation s = 0.0604704, from 6 values between 10.05 and 10.21.
- Within ±1 SD (10.07 to 10.19): 4 of 6 values (67%). About 68% for normal data.
- Within ±2 SD: 6 (100%). About 95% for normal data.
- Within ±3 SD: 6 (100%). About 99.7% for normal data.
Show the working, step by step
More statistics
The formula
The relative standard deviation is the sample standard deviation s divided by the mean x̄, written as a percentage:
%RSD = s ÷ x̄ × 100%
It is the same quantity as the coefficient of variation, which the coefficient of variation calculator reports as a ratio, 0.055 on the example below, against 5.45% when written as a percentage.
Worked example
Six replicate measurements of the same quantity: 10.12, 10.08, 10.21, 10.15, 10.05, 10.18.
- Mean: 60.79 ÷ 6 = 10.132.
- Deviations from the mean: −0.012, −0.052, +0.078, +0.018, −0.082, +0.048.
- Squared deviations: 0.00014, 0.00267, 0.00614, 0.00034, 0.00667, 0.00234. Their sum is 0.01828.
- Sample variance: 0.01828 ÷ (6 − 1) = 0.00366, so s = 0.0605.
- Relative standard deviation: 0.0605 ÷ 10.132 × 100 = 0.597%.
The measurement holds to about six in a thousand of its value, which is the figure to quote when comparing this instrument against another: two measurements agree to better than one part in a thousand only if each is repeatable to that degree. The RSD calculator runs these five steps on any dataset.
Common questions
What is a good relative standard deviation?
For a measurement that is supposed to be repeatable, RSD under 1% is usually tight, 1–5% is moderate, and above 5% the variation is dominating the signal. The number that "counts" depends on the field: quality labs quote %RSD on the method, not the value, and compare it with their own acceptance criterion, not a universal limit. If your RSD is larger than the difference you care about, the measurement noise swallows the signal, and you need more repeats, not a finer scale.
How do you calculate the relative standard deviation?
Divide the standard deviation by the mean and multiply by 100. On the six measurements above, s = 0.0605 and x̄ = 10.13, so %RSD = 0.0605 ÷ 10.13 × 100 = 0.597%. The sample standard deviation uses the n − 1 divisor, the same one the variance calculator uses; switch the calculator to population mode and both figures change slightly.
What is the difference between RSD and the coefficient of variation?
The same number with different names. The coefficient of variation, CV, is s ÷ x̄ as a ratio; RSD is the percentage form. On the example above the CV is 0.0605 ÷ 10.13 = 0.0060 and the RSD is 0.60%, the same relative spread written two ways.
When should I not use the relative standard deviation?
When the mean is near zero, where a tiny denominator blows the ratio up, when the data are not symmetric, or when the measurement cannot meaningfully have a zero point such as a temperature in Celsius. The standard deviation and variance pages cover the underlying measures; use RSD only when the unit matters and the mean is well away from zero.
Does RSD get smaller as I add more measurements?
RSD describes the data you have, so it changes with every added value. What shrinks with more repeats is the standard error of the mean, s ÷ √n, which is the uncertainty of the average itself. The standard error calculator gives that second figure, and the sample size calculator works out how many repeats you need to hit a target precision.
Related calculators
-
RSD calculator
The %RSD of your data, with the working shown.
-
What is a good RSD?
The acceptance criteria people actually use, by field.
-
Coefficient of variation
The same number as a ratio rather than a percentage.
-
Standard deviation calculator
The s you divide by the mean.
-
Standard error
How precise the mean is, as opposed to how spread the data are.