Z table (standard normal table)
A z table lists the area under the standard normal curve to the left of each z-score. Use the lookup box for any z or any area, or read the full negative and positive tables below, from −3.49 to 3.49.
Any z, e.g. 1.53 or −0.84.
A probability such as 0.975, or a percentile such as 97.5%.
Show the working, step by step
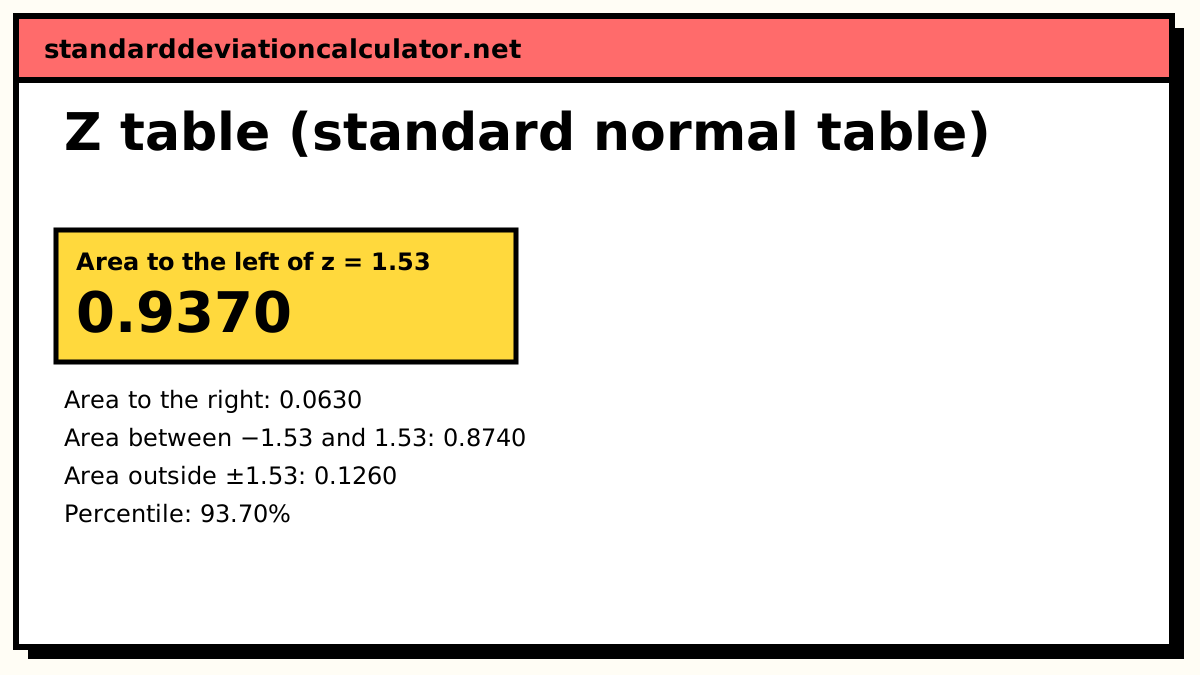
Area to the left is Φ(z), the value in the z table:
Φ(1.53) = 0.9370
Area to the right is what is left of the total area of 1:
1 − 0.9370 = 0.0630
Area between −z and z is the upper cumulative area minus the lower one:
Φ(1.53) − Φ(−1.53) = 0.8740
Φ is the same standard normal CDF the site’s normal distribution calculators use, accurate to better than 1 part in 10 million.
How to read a z table
Each table gives Φ(z), the area to the left of z under the standard normal curve (mean 0, standard deviation 1). The z-score is split in two: the row is z to one decimal place and the column is the second decimal place.
Worked lookup for z = 1.53:
- Split 1.53 into 1.5 and .03.
- In the positive table, go down to row 1.5.
- Go across to column .03. The cell reads 0.9370 (highlighted below).
- So 93.70% of the area lies to the left of z = 1.53, and 1 − 0.9370 = 0.0630 lies to the right.
For z = −1.53, use the negative table: row −1.5, column .03, which gives 0.0630. The two answers add to 1 because the curve is symmetric about 0.
Negative z table
Area to the left of z for z from −3.49 to −0.00. The row is z to one decimal; read the column as the second decimal, so row −1.5, column .03 is z = −1.53.
| z | .00 | .01 | .02 | .03 | .04 | .05 | .06 | .07 | .08 | .09 |
|---|---|---|---|---|---|---|---|---|---|---|
| −3.4 | 0.0003 | 0.0003 | 0.0003 | 0.0003 | 0.0003 | 0.0003 | 0.0003 | 0.0003 | 0.0003 | 0.0002 |
| −3.3 | 0.0005 | 0.0005 | 0.0005 | 0.0004 | 0.0004 | 0.0004 | 0.0004 | 0.0004 | 0.0004 | 0.0003 |
| −3.2 | 0.0007 | 0.0007 | 0.0006 | 0.0006 | 0.0006 | 0.0006 | 0.0006 | 0.0005 | 0.0005 | 0.0005 |
| −3.1 | 0.0010 | 0.0009 | 0.0009 | 0.0009 | 0.0008 | 0.0008 | 0.0008 | 0.0008 | 0.0007 | 0.0007 |
| −3.0 | 0.0013 | 0.0013 | 0.0013 | 0.0012 | 0.0012 | 0.0011 | 0.0011 | 0.0011 | 0.0010 | 0.0010 |
| −2.9 | 0.0019 | 0.0018 | 0.0018 | 0.0017 | 0.0016 | 0.0016 | 0.0015 | 0.0015 | 0.0014 | 0.0014 |
| −2.8 | 0.0026 | 0.0025 | 0.0024 | 0.0023 | 0.0023 | 0.0022 | 0.0021 | 0.0021 | 0.0020 | 0.0019 |
| −2.7 | 0.0035 | 0.0034 | 0.0033 | 0.0032 | 0.0031 | 0.0030 | 0.0029 | 0.0028 | 0.0027 | 0.0026 |
| −2.6 | 0.0047 | 0.0045 | 0.0044 | 0.0043 | 0.0041 | 0.0040 | 0.0039 | 0.0038 | 0.0037 | 0.0036 |
| −2.5 | 0.0062 | 0.0060 | 0.0059 | 0.0057 | 0.0055 | 0.0054 | 0.0052 | 0.0051 | 0.0049 | 0.0048 |
| −2.4 | 0.0082 | 0.0080 | 0.0078 | 0.0075 | 0.0073 | 0.0071 | 0.0069 | 0.0068 | 0.0066 | 0.0064 |
| −2.3 | 0.0107 | 0.0104 | 0.0102 | 0.0099 | 0.0096 | 0.0094 | 0.0091 | 0.0089 | 0.0087 | 0.0084 |
| −2.2 | 0.0139 | 0.0136 | 0.0132 | 0.0129 | 0.0125 | 0.0122 | 0.0119 | 0.0116 | 0.0113 | 0.0110 |
| −2.1 | 0.0179 | 0.0174 | 0.0170 | 0.0166 | 0.0162 | 0.0158 | 0.0154 | 0.0150 | 0.0146 | 0.0143 |
| −2.0 | 0.0228 | 0.0222 | 0.0217 | 0.0212 | 0.0207 | 0.0202 | 0.0197 | 0.0192 | 0.0188 | 0.0183 |
| −1.9 | 0.0287 | 0.0281 | 0.0274 | 0.0268 | 0.0262 | 0.0256 | 0.0250 | 0.0244 | 0.0239 | 0.0233 |
| −1.8 | 0.0359 | 0.0351 | 0.0344 | 0.0336 | 0.0329 | 0.0322 | 0.0314 | 0.0307 | 0.0301 | 0.0294 |
| −1.7 | 0.0446 | 0.0436 | 0.0427 | 0.0418 | 0.0409 | 0.0401 | 0.0392 | 0.0384 | 0.0375 | 0.0367 |
| −1.6 | 0.0548 | 0.0537 | 0.0526 | 0.0516 | 0.0505 | 0.0495 | 0.0485 | 0.0475 | 0.0465 | 0.0455 |
| −1.5 | 0.0668 | 0.0655 | 0.0643 | 0.0630 | 0.0618 | 0.0606 | 0.0594 | 0.0582 | 0.0571 | 0.0559 |
| −1.4 | 0.0808 | 0.0793 | 0.0778 | 0.0764 | 0.0749 | 0.0735 | 0.0721 | 0.0708 | 0.0694 | 0.0681 |
| −1.3 | 0.0968 | 0.0951 | 0.0934 | 0.0918 | 0.0901 | 0.0885 | 0.0869 | 0.0853 | 0.0838 | 0.0823 |
| −1.2 | 0.1151 | 0.1131 | 0.1112 | 0.1093 | 0.1075 | 0.1056 | 0.1038 | 0.1020 | 0.1003 | 0.0985 |
| −1.1 | 0.1357 | 0.1335 | 0.1314 | 0.1292 | 0.1271 | 0.1251 | 0.1230 | 0.1210 | 0.1190 | 0.1170 |
| −1.0 | 0.1587 | 0.1562 | 0.1539 | 0.1515 | 0.1492 | 0.1469 | 0.1446 | 0.1423 | 0.1401 | 0.1379 |
| −0.9 | 0.1841 | 0.1814 | 0.1788 | 0.1762 | 0.1736 | 0.1711 | 0.1685 | 0.1660 | 0.1635 | 0.1611 |
| −0.8 | 0.2119 | 0.2090 | 0.2061 | 0.2033 | 0.2005 | 0.1977 | 0.1949 | 0.1922 | 0.1894 | 0.1867 |
| −0.7 | 0.2420 | 0.2389 | 0.2358 | 0.2327 | 0.2296 | 0.2266 | 0.2236 | 0.2206 | 0.2177 | 0.2148 |
| −0.6 | 0.2743 | 0.2709 | 0.2676 | 0.2643 | 0.2611 | 0.2578 | 0.2546 | 0.2514 | 0.2483 | 0.2451 |
| −0.5 | 0.3085 | 0.3050 | 0.3015 | 0.2981 | 0.2946 | 0.2912 | 0.2877 | 0.2843 | 0.2810 | 0.2776 |
| −0.4 | 0.3446 | 0.3409 | 0.3372 | 0.3336 | 0.3300 | 0.3264 | 0.3228 | 0.3192 | 0.3156 | 0.3121 |
| −0.3 | 0.3821 | 0.3783 | 0.3745 | 0.3707 | 0.3669 | 0.3632 | 0.3594 | 0.3557 | 0.3520 | 0.3483 |
| −0.2 | 0.4207 | 0.4168 | 0.4129 | 0.4090 | 0.4052 | 0.4013 | 0.3974 | 0.3936 | 0.3897 | 0.3859 |
| −0.1 | 0.4602 | 0.4562 | 0.4522 | 0.4483 | 0.4443 | 0.4404 | 0.4364 | 0.4325 | 0.4286 | 0.4247 |
| −0.0 | 0.5000 | 0.4960 | 0.4920 | 0.4880 | 0.4840 | 0.4801 | 0.4761 | 0.4721 | 0.4681 | 0.4641 |
Positive z table
Area to the left of z for z from 0.00 to 3.49. Row 1.5, column .03 is z = 1.53, highlighted. Beyond 3.49 the area to the left rounds to 0.9998 or more; the lookup box handles any z.
| z | .00 | .01 | .02 | .03 | .04 | .05 | .06 | .07 | .08 | .09 |
|---|---|---|---|---|---|---|---|---|---|---|
| 0.0 | 0.5000 | 0.5040 | 0.5080 | 0.5120 | 0.5160 | 0.5199 | 0.5239 | 0.5279 | 0.5319 | 0.5359 |
| 0.1 | 0.5398 | 0.5438 | 0.5478 | 0.5517 | 0.5557 | 0.5596 | 0.5636 | 0.5675 | 0.5714 | 0.5753 |
| 0.2 | 0.5793 | 0.5832 | 0.5871 | 0.5910 | 0.5948 | 0.5987 | 0.6026 | 0.6064 | 0.6103 | 0.6141 |
| 0.3 | 0.6179 | 0.6217 | 0.6255 | 0.6293 | 0.6331 | 0.6368 | 0.6406 | 0.6443 | 0.6480 | 0.6517 |
| 0.4 | 0.6554 | 0.6591 | 0.6628 | 0.6664 | 0.6700 | 0.6736 | 0.6772 | 0.6808 | 0.6844 | 0.6879 |
| 0.5 | 0.6915 | 0.6950 | 0.6985 | 0.7019 | 0.7054 | 0.7088 | 0.7123 | 0.7157 | 0.7190 | 0.7224 |
| 0.6 | 0.7257 | 0.7291 | 0.7324 | 0.7357 | 0.7389 | 0.7422 | 0.7454 | 0.7486 | 0.7517 | 0.7549 |
| 0.7 | 0.7580 | 0.7611 | 0.7642 | 0.7673 | 0.7704 | 0.7734 | 0.7764 | 0.7794 | 0.7823 | 0.7852 |
| 0.8 | 0.7881 | 0.7910 | 0.7939 | 0.7967 | 0.7995 | 0.8023 | 0.8051 | 0.8078 | 0.8106 | 0.8133 |
| 0.9 | 0.8159 | 0.8186 | 0.8212 | 0.8238 | 0.8264 | 0.8289 | 0.8315 | 0.8340 | 0.8365 | 0.8389 |
| 1.0 | 0.8413 | 0.8438 | 0.8461 | 0.8485 | 0.8508 | 0.8531 | 0.8554 | 0.8577 | 0.8599 | 0.8621 |
| 1.1 | 0.8643 | 0.8665 | 0.8686 | 0.8708 | 0.8729 | 0.8749 | 0.8770 | 0.8790 | 0.8810 | 0.8830 |
| 1.2 | 0.8849 | 0.8869 | 0.8888 | 0.8907 | 0.8925 | 0.8944 | 0.8962 | 0.8980 | 0.8997 | 0.9015 |
| 1.3 | 0.9032 | 0.9049 | 0.9066 | 0.9082 | 0.9099 | 0.9115 | 0.9131 | 0.9147 | 0.9162 | 0.9177 |
| 1.4 | 0.9192 | 0.9207 | 0.9222 | 0.9236 | 0.9251 | 0.9265 | 0.9279 | 0.9292 | 0.9306 | 0.9319 |
| 1.5 | 0.9332 | 0.9345 | 0.9357 | 0.9370 | 0.9382 | 0.9394 | 0.9406 | 0.9418 | 0.9429 | 0.9441 |
| 1.6 | 0.9452 | 0.9463 | 0.9474 | 0.9484 | 0.9495 | 0.9505 | 0.9515 | 0.9525 | 0.9535 | 0.9545 |
| 1.7 | 0.9554 | 0.9564 | 0.9573 | 0.9582 | 0.9591 | 0.9599 | 0.9608 | 0.9616 | 0.9625 | 0.9633 |
| 1.8 | 0.9641 | 0.9649 | 0.9656 | 0.9664 | 0.9671 | 0.9678 | 0.9686 | 0.9693 | 0.9699 | 0.9706 |
| 1.9 | 0.9713 | 0.9719 | 0.9726 | 0.9732 | 0.9738 | 0.9744 | 0.9750 | 0.9756 | 0.9761 | 0.9767 |
| 2.0 | 0.9772 | 0.9778 | 0.9783 | 0.9788 | 0.9793 | 0.9798 | 0.9803 | 0.9808 | 0.9812 | 0.9817 |
| 2.1 | 0.9821 | 0.9826 | 0.9830 | 0.9834 | 0.9838 | 0.9842 | 0.9846 | 0.9850 | 0.9854 | 0.9857 |
| 2.2 | 0.9861 | 0.9864 | 0.9868 | 0.9871 | 0.9875 | 0.9878 | 0.9881 | 0.9884 | 0.9887 | 0.9890 |
| 2.3 | 0.9893 | 0.9896 | 0.9898 | 0.9901 | 0.9904 | 0.9906 | 0.9909 | 0.9911 | 0.9913 | 0.9916 |
| 2.4 | 0.9918 | 0.9920 | 0.9922 | 0.9925 | 0.9927 | 0.9929 | 0.9931 | 0.9932 | 0.9934 | 0.9936 |
| 2.5 | 0.9938 | 0.9940 | 0.9941 | 0.9943 | 0.9945 | 0.9946 | 0.9948 | 0.9949 | 0.9951 | 0.9952 |
| 2.6 | 0.9953 | 0.9955 | 0.9956 | 0.9957 | 0.9959 | 0.9960 | 0.9961 | 0.9962 | 0.9963 | 0.9964 |
| 2.7 | 0.9965 | 0.9966 | 0.9967 | 0.9968 | 0.9969 | 0.9970 | 0.9971 | 0.9972 | 0.9973 | 0.9974 |
| 2.8 | 0.9974 | 0.9975 | 0.9976 | 0.9977 | 0.9977 | 0.9978 | 0.9979 | 0.9979 | 0.9980 | 0.9981 |
| 2.9 | 0.9981 | 0.9982 | 0.9982 | 0.9983 | 0.9984 | 0.9984 | 0.9985 | 0.9985 | 0.9986 | 0.9986 |
| 3.0 | 0.9987 | 0.9987 | 0.9987 | 0.9988 | 0.9988 | 0.9989 | 0.9989 | 0.9989 | 0.9990 | 0.9990 |
| 3.1 | 0.9990 | 0.9991 | 0.9991 | 0.9991 | 0.9992 | 0.9992 | 0.9992 | 0.9992 | 0.9993 | 0.9993 |
| 3.2 | 0.9993 | 0.9993 | 0.9994 | 0.9994 | 0.9994 | 0.9994 | 0.9994 | 0.9995 | 0.9995 | 0.9995 |
| 3.3 | 0.9995 | 0.9995 | 0.9995 | 0.9996 | 0.9996 | 0.9996 | 0.9996 | 0.9996 | 0.9996 | 0.9997 |
| 3.4 | 0.9997 | 0.9997 | 0.9997 | 0.9997 | 0.9997 | 0.9997 | 0.9997 | 0.9997 | 0.9997 | 0.9998 |
Left, right and between areas
The table gives only the area to the left. The other two areas follow from it:
left of z: Φ(z) right of z: 1 − Φ(z) between z₁ and z₂: Φ(z₂) − Φ(z₁)
Between example: the area between z = −1 and z = 1.5 is Φ(1.5) − Φ(−1) = 0.9332 − 0.1587 = 0.7745, so about 77% of a normal distribution lies in that range. For a symmetric range, the area between −z and z is 2Φ(z) − 1; for z = 1.53 that is 2 × 0.9370 − 1 = 0.8740.
From a score to a percentile
IQ scores are normal with mean 100 and standard deviation 15. What percentile is a score of 123?
- Standardise the score: z = (x − μ) / σ = (123 − 100) / 15 = 1.533, which rounds to 1.53 for the table.
- Look up z = 1.53: row 1.5, column .03 gives 0.9370.
- Convert to a percentile: 0.9370 × 100 = 93.7, so a score of 123 is at about the 94th percentile.
Rounding z to two decimals costs a little precision: the unrounded z = 1.5333 gives 0.9374. The z-score calculator does the first step for you, and the lookup box above takes z to as many decimals as you like.
Common z values
A few z-scores come up so often that they are worth knowing without the table. They are the critical values for one-sided and two-sided tests and the multipliers for confidence intervals.
| z | Area to the left | Area between −z and z | Typical use |
|---|---|---|---|
| 1.645 | 0.9500 | 0.9000 | One-sided 95%, two-sided 90% |
| 1.96 | 0.9750 | 0.9500 | Two-sided 95% confidence interval |
| 2.576 | 0.9950 | 0.9900 | Two-sided 99% confidence interval |
The 68–95–99.7 rule comes from the same table. The area within one standard deviation of the mean is Φ(1) − Φ(−1) = 0.6827, within two it is 0.9545 and within three it is 0.9973. The empirical rule calculator turns these into actual ranges for your mean and standard deviation. To go from an area to a cut-off on your own scale, use the inverse normal distribution calculator.
The tables use the standard normal cumulative distribution function described in the NIST/SEMATECH e-Handbook of Statistical Methods (section 1.3.6.7.1), evaluated to better than 1 part in 10 million and rounded to 4 decimal places.
Common questions
How do you read a z table?
Split the z-score into its first decimal and its second decimal. Find the row for the first part (1.5 for z = 1.53), then the column for the second (.03). The cell where they meet, 0.9370, is the area under the standard normal curve to the left of z. This page’s tables are cumulative from the far left, like most textbook tables.
What is the area to the left of z = 1.96?
0.9750. Row 1.9, column .06 of the positive table gives Φ(1.96) = 0.9750, so 97.5% of the distribution lies below 1.96 and 2.5% above it. With 2.5% in each tail, the middle 95% lies between −1.96 and 1.96, which is why 1.96 is the z for a 95% confidence interval.
How do you use a z table for negative z-scores?
Use the negative table: the row is the z-score to one decimal with its minus sign (−0.8 for z = −0.84) and the column is the second decimal (.04). That gives 0.2005. If you only have a positive table, use symmetry: Φ(−z) = 1 − Φ(z), so Φ(−0.84) = 1 − 0.7995 = 0.2005.
How do you find a percentile from a z-score?
Look up the area to the left of z and multiply by 100. For z = 0.84 the table gives 0.7995, so the value sits at about the 80th percentile. To go the other way, find the cell closest to the percentile (0.8000 for the 80th) and read off its row and column, or use the lookup box, which gives z = 0.8416.
What is the difference between a z table and a t table?
A z table gives areas under the standard normal curve, for use when the population standard deviation is known or the sample is large. A t table gives critical values of the t distribution, which has heavier tails and changes with the degrees of freedom. At 10 degrees of freedom the two-sided 95% value is 2.228, against 1.96 from the z table; as the degrees of freedom grow, t approaches z. The critical value calculator gives both.
Related calculators
-
Z-score calculator
Turn a raw score, mean and SD into z before you look it up.
-
Percentile calculator
Percentiles of your own data rather than of the normal curve.
-
Inverse normal distribution
From an area to a cut-off value on any normal scale.
-
Empirical rule calculator
The 68–95–99.7 bands for your mean and SD.
-
Critical value calculator
z, t, chi-square and F critical values, the t table included.