Binomial table (cumulative, p = 0.5)
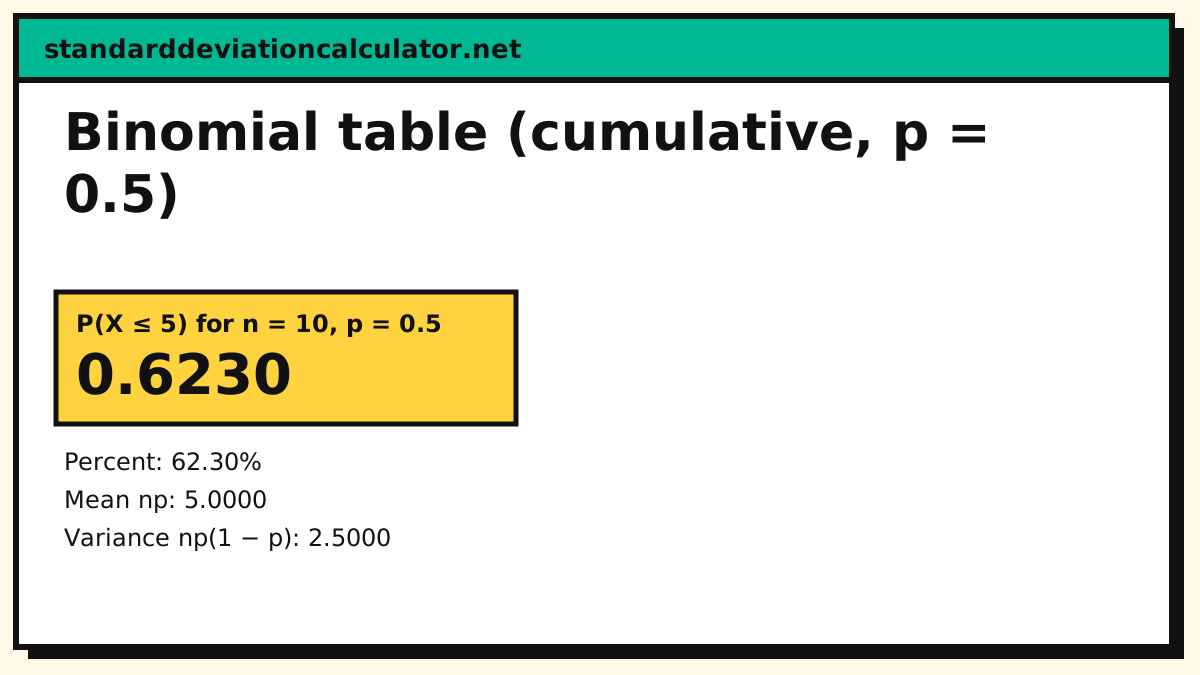
A binomial table gives the cumulative probabilities of getting at most k successes in n trials. The printed table below covers the classic case of fair trials, p = 0.5; the lookup box above handles any n and p, exactly.
The number of independent yes/no trials.
Between 0 and 1; 0.5 is a fair coin.
The number of successes, from 0 to n.
Show the working, step by step
At most k successes: add the probabilities of 0, 1, …, k successes.
P(X ≤ 5) = Σ C(10, j) · 0.5ʲ · 0.5^{10−j}, j = 0 to 5 = 0.6230
The distribution is centred at np with spread √(np(1 − p)); the lookup box and the table below use the same CDF.
mean = 5, sd = 1.581
These are the exact binomial probabilities; the Poisson table is the shortcut when n is large and p is small, with λ = np.
How to read the table
Each row is a number of trials n; each column is a number of successes k. The cell is the probability that at most k of the n fair trials are successes,
P(X ≤ k) = Σ C(n, j) · 0.5ⁿ, j = 0 to k
Worked lookup for 10 coin flips, "at most 3 heads":
- Find the row n = 10.
- Find the column k = 3.
- The cell reads 0.1719 (highlighted below), which is 176 of 1024 equally likely sequences.
- For "at least 7 heads" subtract from 1 using column k = 6: 1 − 0.8281 = 0.1719, symmetric around k = 5.
| n | 0 | 1 | 2 | 3 | 4 | 5 | 6 | 7 | 8 | 9 | 10 |
|---|---|---|---|---|---|---|---|---|---|---|---|
| 1 | 1.0000 | 1.0000 | 1.0000 | 1.0000 | 1.0000 | 1.0000 | 1.0000 | 1.0000 | 1.0000 | 1.0000 | |
| 2 | 1.0000 | 1.0000 | 1.0000 | 1.0000 | 1.0000 | 1.0000 | 1.0000 | 1.0000 | 1.0000 | ||
| 3 | 1.0000 | 1.0000 | 1.0000 | 1.0000 | 1.0000 | 1.0000 | 1.0000 | 1.0000 | |||
| 4 | 1.0000 | 1.0000 | 1.0000 | 1.0000 | 1.0000 | 1.0000 | 1.0000 | ||||
| 5 | 1.0000 | 1.0000 | 1.0000 | 1.0000 | 1.0000 | 1.0000 | |||||
| 6 | 1.0000 | 1.0000 | 1.0000 | 1.0000 | 1.0000 | ||||||
| 7 | 1.0000 | 1.0000 | 1.0000 | 1.0000 | |||||||
| 8 | 1.0000 | 1.0000 | 1.0000 | ||||||||
| 9 | 1.0000 | 1.0000 | |||||||||
| 10 | 1.0000 | ||||||||||
| 12 | |||||||||||
| 15 | |||||||||||
| 20 | |||||||||||
| 25 |
Shape and the usual rules of thumb
The number of successes X in n trials has mean np, variance np(1 − p) and standard deviation √(np(1 − p)). For fair trials that is n/2 and √(n/4), so the middle cell of the table always sits near P(X ≤ n/2) ≈ 0.5, slightly above it for even n because the single most likely value n/2 itself still carries probability. The 68–95–99.7 bands are the distribution's: within n/2 ± √(n/4) of the mean sits about two thirds of the mass, which the table shows as the gap between the columns k = n/2 − √(n/4) and k = n/2 + √(n/4).
The classic approximation threshold is np ≥ 5 and n(1 − p) ≥ 5, when the normal with mean np and variance np(1 − p) is a good stand-in and the z table replaces this one. All values are computed by the same binomial CDF the binomial distribution calculator uses, rounded to 4 decimal places.
Common questions
How do you read a binomial table?
Find n, the number of trials, down the left and k, the maximum number of successes you allow, across the top. The cell is P(X ≤ k) for fair trials. For n = 10 and k = 3 that is 0.1719, the 176/1024 coin-toss calculation. If k exceeds n the cell is empty: with 6 trials there are no outcomes with 8 successes, so P(X ≤ 8) is 1.
Why does the binomial table only cover p = 0.5?
Printing space: a table for every p would need one column per p, so the classic reference is the symmetric case p = 0.5, which is also the only one where "success" has no meaning. For any other p use the lookup box above, which runs the exact binomial CDF, or the binomial distribution calculator, which gives the whole distribution for your n and p.
What is the probability of at least 7 heads in 10 coin flips?
The table gives "at most" values, so P(X ≥ 7) = 1 − P(X ≤ 6). Row n = 10, column 6 reads 0.8281, so the answer is 1 − 0.8281 = 0.1719 — the same as P(X ≤ 3), by the fair-coin symmetry around 5. The lookup box above computes it directly in the "At least k" mode.
How does the binomial table differ from the Poisson table?
The binomial counts successes in a fixed number of trials with a known success probability; the Poisson counts events in a fixed interval with a known average rate. They connect through λ = n·p: for large n and small p the Poisson is a fast approximation, and the normal distribution approximates both when the mean is large. The Poisson table is the companion page.
When should I use the normal approximation instead of the binomial?
When the exact binomial arithmetic outgrows the table: roughly np and n(1 − p) both at least 5, which is also the usual rule of thumb. With a continuity correction the approximation is close; without it it can be off by a noticeable amount at the ends. The lookup box and the binomial calculator keep the exact value, so use the approximation only to check the scale of an answer, not to state it.
Related calculators
-
Binomial distribution calculator
The whole distribution for any n and p, not just fair trials.
-
Poisson table
The event-count companion table, by mean rate λ.
-
Normal distribution calculator
The large-sample approximation to both.
-
Coin flip probability calculator
The p = 0.5 case with a chart of every outcome count.
-
Z table
The normal table the approximation reads from.