Poisson table (cumulative, by mean rate λ)
A Poisson table gives the cumulative probabilities of at most k events when events happen at an average rate λ. The printed table below covers λ from 0.5 to 5.0; the lookup box above handles any λ and k, exactly.
The average number of events, or mean × interval.
A whole number of events, 0 or more.
Show the working, step by step
At most k events: add the probabilities of 0, 1, …, k events.
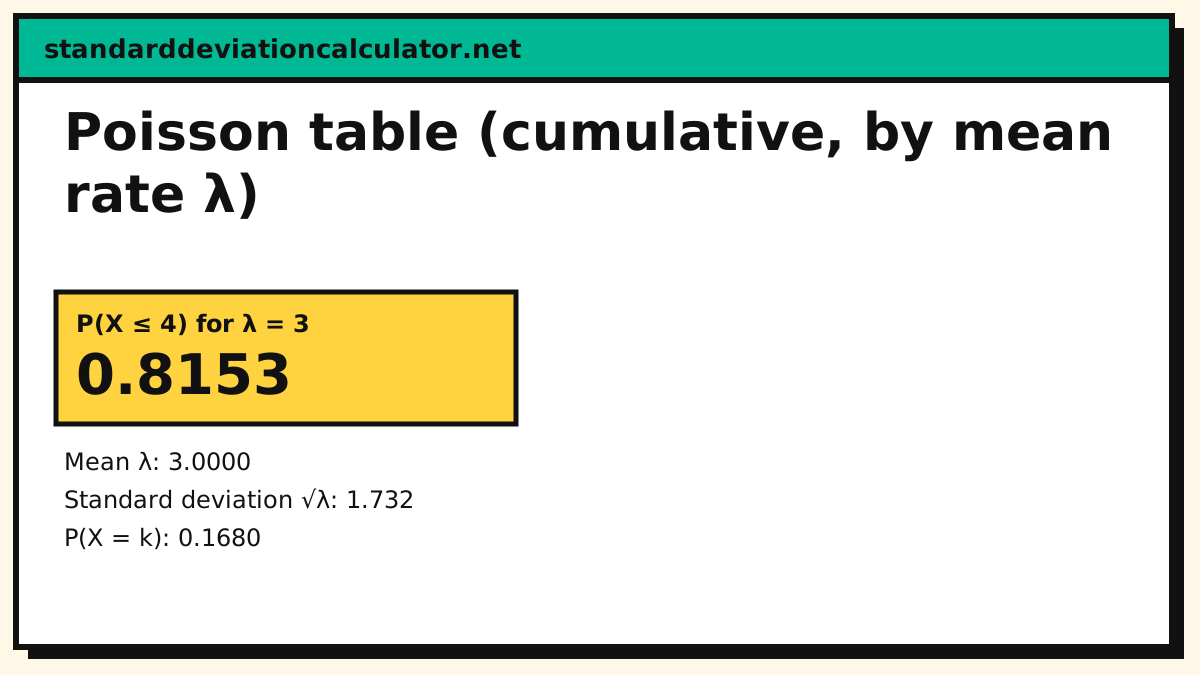
P(X ≤ 4) = Σ e^{−3} · 3ʲ ÷ j!, j = 0 to 4 = 0.8153
The Poisson is the limit of the binomial for many rare trials, mean λ = np; it applies to counts in a fixed interval, not to yes/no trials.
mean = λ = 3, variance = λ = 3
The lookup box and the printed table use the same Poisson CDF the site’s Poisson distribution calculator uses.
How to read the table
Each row is a mean rate λ; each column is a number of events k. The cell is the probability of k or fewer events,
P(X ≤ k) = Σ e^(−λ) · λʲ ÷ j! (j = 0 to k)
Worked lookup for λ = 3.0, "at most 4 events":
- Find the row λ = 3.0.
- Find the column k = 4.
- The cell reads 0.8153 (highlighted below).
- For "5 or more events" subtract from 1: 1 − 0.8153 = 0.1847.
| λ | 0 | 1 | 2 | 3 | 4 | 5 | 6 | 7 | 8 |
|---|---|---|---|---|---|---|---|---|---|
| 0.5 | 0.6065 | 0.9098 | 0.9856 | 0.9982 | 0.9998 | 1.0000 | 1.0000 | 1.0000 | 1.0000 |
| 1.0 | 0.3679 | 0.7358 | 0.9197 | 0.9810 | 0.9963 | 0.9994 | 0.9999 | 1.0000 | 1.0000 |
| 1.5 | 0.2231 | 0.5578 | 0.8088 | 0.9344 | 0.9814 | 0.9955 | 0.9991 | 0.9998 | 1.0000 |
| 2.0 | 0.1353 | 0.4060 | 0.6767 | 0.8571 | 0.9473 | 0.9834 | 0.9955 | 0.9989 | 0.9998 |
| 2.5 | 0.0821 | 0.2873 | 0.5438 | 0.7576 | 0.8912 | 0.9580 | 0.9858 | 0.9958 | 0.9989 |
| 3.0 | 0.0498 | 0.1991 | 0.4232 | 0.6472 | 0.8153 | 0.9161 | 0.9665 | 0.9881 | 0.9962 |
| 3.5 | 0.0302 | 0.1359 | 0.3208 | 0.5366 | 0.7254 | 0.8576 | 0.9347 | 0.9733 | 0.9901 |
| 4.0 | 0.0183 | 0.0916 | 0.2381 | 0.4335 | 0.6288 | 0.7851 | 0.8893 | 0.9489 | 0.9786 |
| 4.5 | 0.0111 | 0.0611 | 0.1736 | 0.3423 | 0.5321 | 0.7029 | 0.8311 | 0.9134 | 0.9597 |
| 5.0 | 0.0067 | 0.0404 | 0.1247 | 0.2650 | 0.4405 | 0.6160 | 0.7622 | 0.8666 | 0.9319 |
Shape, and where the Poisson table comes from
The Poisson distribution models counts of independent, rare events over a fixed interval, with mean λ and variance λ. That single parameter drives the whole table: along a row, the cumulative curve climbs faster for large λ because the distribution sits further right. Because the mean equals the variance, the standard deviation is √λ, and the 68–95–99.7 bands sit at λ ± √λ, λ ± 2√λ and so on.
The table is a limit of the binomial: take a binomial with n trials and success probability p, hold np = λ fixed and let n grow without bound, and the probabilities approach the Poisson. That is why the λ = n·p shortcut works when n is large and p is small. All values are computed by the same Poisson CDF the Poisson distribution calculator uses, rounded to 4 decimal places.
Common questions
How do you read a Poisson table?
Find your mean rate λ down the left and the maximum number of events k across the top. The cell is P(X ≤ k), the chance of k or fewer events. For λ = 3 and k = 4 that is 0.8153. For "at least k" subtract from 1: P(X ≥ 5) = 1 − P(X ≤ 4) = 0.1847. The lookup box above gives the exact probability for any λ and k, not just the printed grid.
How do I find λ, the mean rate?
λ is the average count over the interval: the total events divided by the number of intervals, or the rate per unit time times the interval length. If a machine averages 0.4 defects per part, then in a batch of 10 parts λ = 0.4 × 10 = 4. Use the mean you have, scaled to the interval your question is about, and the table's λ row for it. The Poisson distribution calculator takes λ directly.
What is P(X = 2) from the Poisson table?
The table lists cumulative values, so P(X = 2) = P(X ≤ 2) − P(X ≤ 1). For λ = 3 that is 0.4232 − 0.1991 = 0.2241, agreeing with the single value e⁻³·3²/2! = 0.2240 to four decimal places. The "Exactly k" mode of the lookup box above returns the mass directly.
When should I use the Poisson table instead of the binomial?
When events are counts over an interval at a roughly constant rate, or when you have a binomial with large n and small p, in which case λ = np carries the information. The Poisson table is then a fast approximation of the binomial. The rule of thumb is n ≥ 20 and p ≤ 0.05, or n ≥ 100 and p ≤ 0.01; outside that the binomial distribution calculator is the exact answer.
Is the Poisson distribution symmetric?
No, it is right-skewed: a mass at 0 and a long tail, with skewness 1/√λ. The larger λ, the more the table's cumulative curve flattens toward the normal. That is why, for large λ, the normal table replaces this one and the normal distribution calculator gives the same areas.
Related calculators
-
Poisson distribution calculator
The whole distribution for any λ, not just the printed grid.
-
Binomial table
The trial-count companion; Poisson is its large-n, small-p limit.
-
Binomial distribution calculator
The exact answer the Poisson approximates.
-
Normal distribution calculator
The large-λ approximation.
-
Z table
The normal table the approximation reads from.