Chi-square table (χ² critical values)
A chi-square table lists the critical values of the χ² distribution: the cut-offs beyond which a test on counts is significant. Use the lookup box for any df, any α or an observed χ², or read the printed upper-tail table below, from df 1 to 1000.
0.05 is the usual choice.
k − 1 for goodness of fit over k categories, (r − 1)(c − 1) for an r × c independence table.
The chi-square statistic your test produced.
Show the working, step by step
The critical value is the point with α = 0.05 of the chi-square distribution's area in the upper tail.
Read it from the table (row df, column α) or compute it:
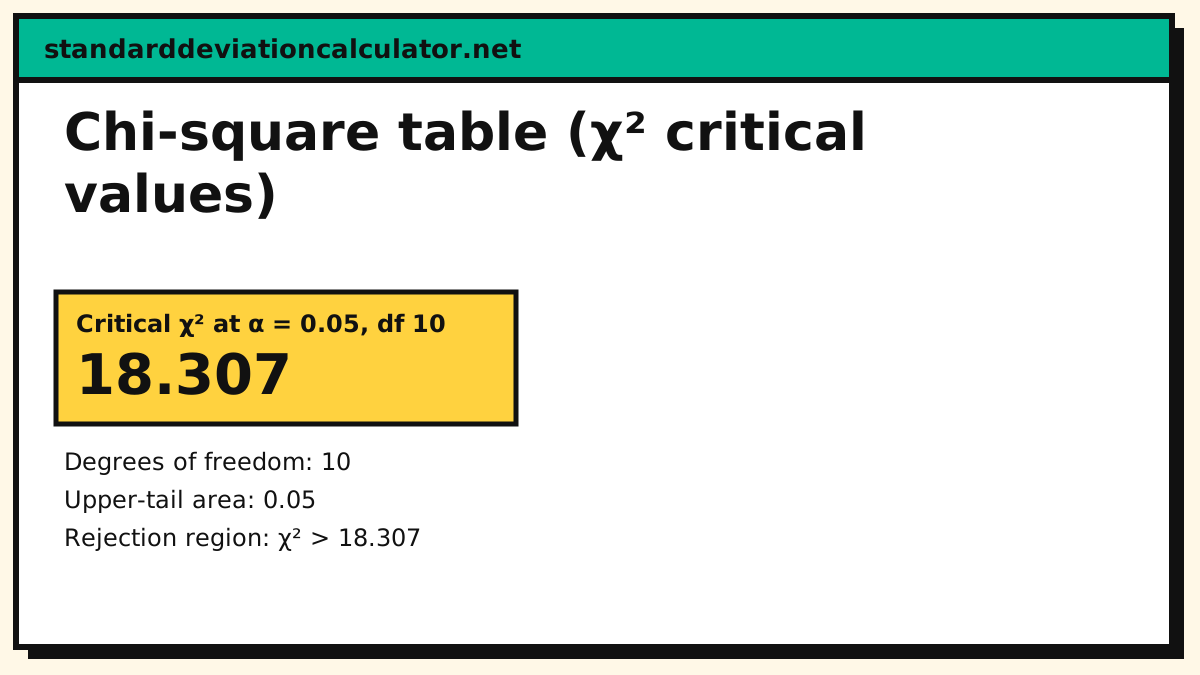
χ²* = 18.307
Larger df means a larger critical value: the distribution spreads out, so the same tail area sits further to the right.
For df 11 the 0.05 value is 19.675 against 18.307 here
The printed table below lists the usual α levels for df up to 30; this tool handles any α and any df.
How to read a chi-square table
The rows are the degrees of freedom and the columns the significance levels. Every cell is an upper-tail value: the point with α of the distribution's area to its right. A chi-square test always rejects when the statistic clears that point, because the statistic is a sum of squared deviations and cannot be negative.
Worked lookup for df = 10, α = 0.05:
- Find the row df = 10.
- Find the column 0.05.
- The cell reads 18.307 (highlighted below).
- A test statistic above 18.307 is significant at the 5% level; at or below it, it is not.
The exact p-value for a statistic between two table columns is one of the most common "what does this number mean" questions. The lookup box above answers it precisely; the table is enough for the decision at a fixed α.
| df | 0.1 | 0.05 | 0.025 | 0.01 | 0.005 |
|---|---|---|---|---|---|
| 1 | 2.706 | 3.841 | 5.024 | 6.635 | 7.879 |
| 2 | 4.605 | 5.991 | 7.378 | 9.210 | 10.597 |
| 3 | 6.251 | 7.815 | 9.348 | 11.345 | 12.838 |
| 4 | 7.779 | 9.488 | 11.143 | 13.277 | 14.860 |
| 5 | 9.236 | 11.070 | 12.833 | 15.086 | 16.750 |
| 6 | 10.645 | 12.592 | 14.449 | 16.812 | 18.548 |
| 7 | 12.017 | 14.067 | 16.013 | 18.475 | 20.278 |
| 8 | 13.362 | 15.507 | 17.535 | 20.090 | 21.955 |
| 9 | 14.684 | 16.919 | 19.023 | 21.666 | 23.589 |
| 10 | 15.987 | 18.307 | 20.483 | 23.209 | 25.188 |
| 15 | 22.307 | 24.996 | 27.488 | 30.578 | 32.801 |
| 20 | 28.412 | 31.410 | 34.170 | 37.566 | 39.997 |
| 25 | 34.382 | 37.652 | 40.646 | 44.314 | 46.928 |
| 30 | 40.256 | 43.773 | 46.979 | 50.892 | 53.672 |
| 40 | 51.805 | 55.758 | 59.342 | 63.691 | 66.766 |
| 50 | 63.167 | 67.505 | 71.420 | 76.154 | 79.490 |
| 60 | 74.397 | 79.082 | 83.298 | 88.379 | 91.952 |
| 100 | 118.498 | 124.342 | 129.561 | 135.807 | 140.169 |
| 1000 | 1057.724 | 1074.679 | 1089.531 | 1106.969 | 1118.948 |
Where the degrees of freedom come from
Two chi-square tests use the table, and each has its own df rule:
- Goodness of fit over k categories has df = k − 1. The expected counts carry one constraint — they must total the observed sample size — so one degree of freedom is spent fitting them. The chi-square calculator runs the test from your observed and expected counts.
- Independence on an r × c table has df = (r − 1)(c − 1): each of the r − 1 free row proportions and c − 1 free column proportions is estimated from the data. A 2 × 2 table, the workhorse of the field, has just 1 degree of freedom, so its 0.05 value is the same 3.841 as any other df = 1 test.
Why the values grow the way they do
A chi-square distribution with df degrees of freedom is a sum of df standard-normal squares, so its mean is df and its spread grows with it. That is why, down any column, the critical value rises with df (df 10 at 0.05 is 18.307, df 30 is 43.773, df 1000 is 1,074.679). Reading a table with the wrong df is the classic silent error: at the same statistic the p-value changes by orders of magnitude between df 2 and df 30, and a goodness-of-fit test whose expected counts were fitted to the data must hand the fitted parameters their degrees of freedom, or the statistic sits too far right and the test rejects too often.
The values are computed by the same inverse-CDF routine as the critical value calculator, not transcribed from a printed table, and rounded to 3 decimal places.
Common questions
How do you read a chi-square table?
Find your degrees of freedom down the left column and your significance level across the top; the cell where they meet is the critical value χ²*. A chi-square test is always upper-tailed, so reject the null when your statistic exceeds χ²*. For df = 10 at α = 0.05 that cell is 18.307: a test statistic of 18.31 or more is significant at the 5% level.
How do I work out the degrees of freedom?
They depend on the test. For goodness of fit over k categories, df = k − 1. For a test of independence on an r × c table, df = (r − 1)(c − 1). A 3 × 4 table therefore has (3 − 1)(4 − 1) = 6. The degrees of freedom calculator does this from your table dimensions.
What is the critical chi-square value at 95% with 10 degrees of freedom?
18.307 for the upper tail at α = 0.05, which is row df = 10, column 0.05 of the table above. Because a chi-square statistic cannot be negative, "95% confidence" here means the value with 5% of the distribution's area above it. The critical value calculator gives it at any α.
Why are chi-square tables only upper-tailed?
The chi-square statistic is a sum of squared standardised deviations, so it is always non-negative and every departure from the null makes it larger. All the evidence against H₀ sits in the right-hand tail, which is why the table lists the value with α area above it and there is no left-tail counterpart.
How do I get a p-value from the chi-square table?
The table gives cut-offs, not exact p-values. If your statistic sits between two columns of the table, your p-value sits between those columns' α levels. For the exact p-value use the lookup box above or the p value calculator; modern reporting prefers the exact p-value over the table's "somewhere between 0.05 and 0.01".
Related calculators
-
Chi-square calculator
Goodness of fit and independence from your counts.
-
Critical value calculator
z, t, chi-square and F critical values at any α.
-
P-value calculator
The exact p-value behind a table cut-off.
-
T table
The two-tailed counterpart for tests on means.
-
F table
Critical F values for ANOVA and two-variance tests.